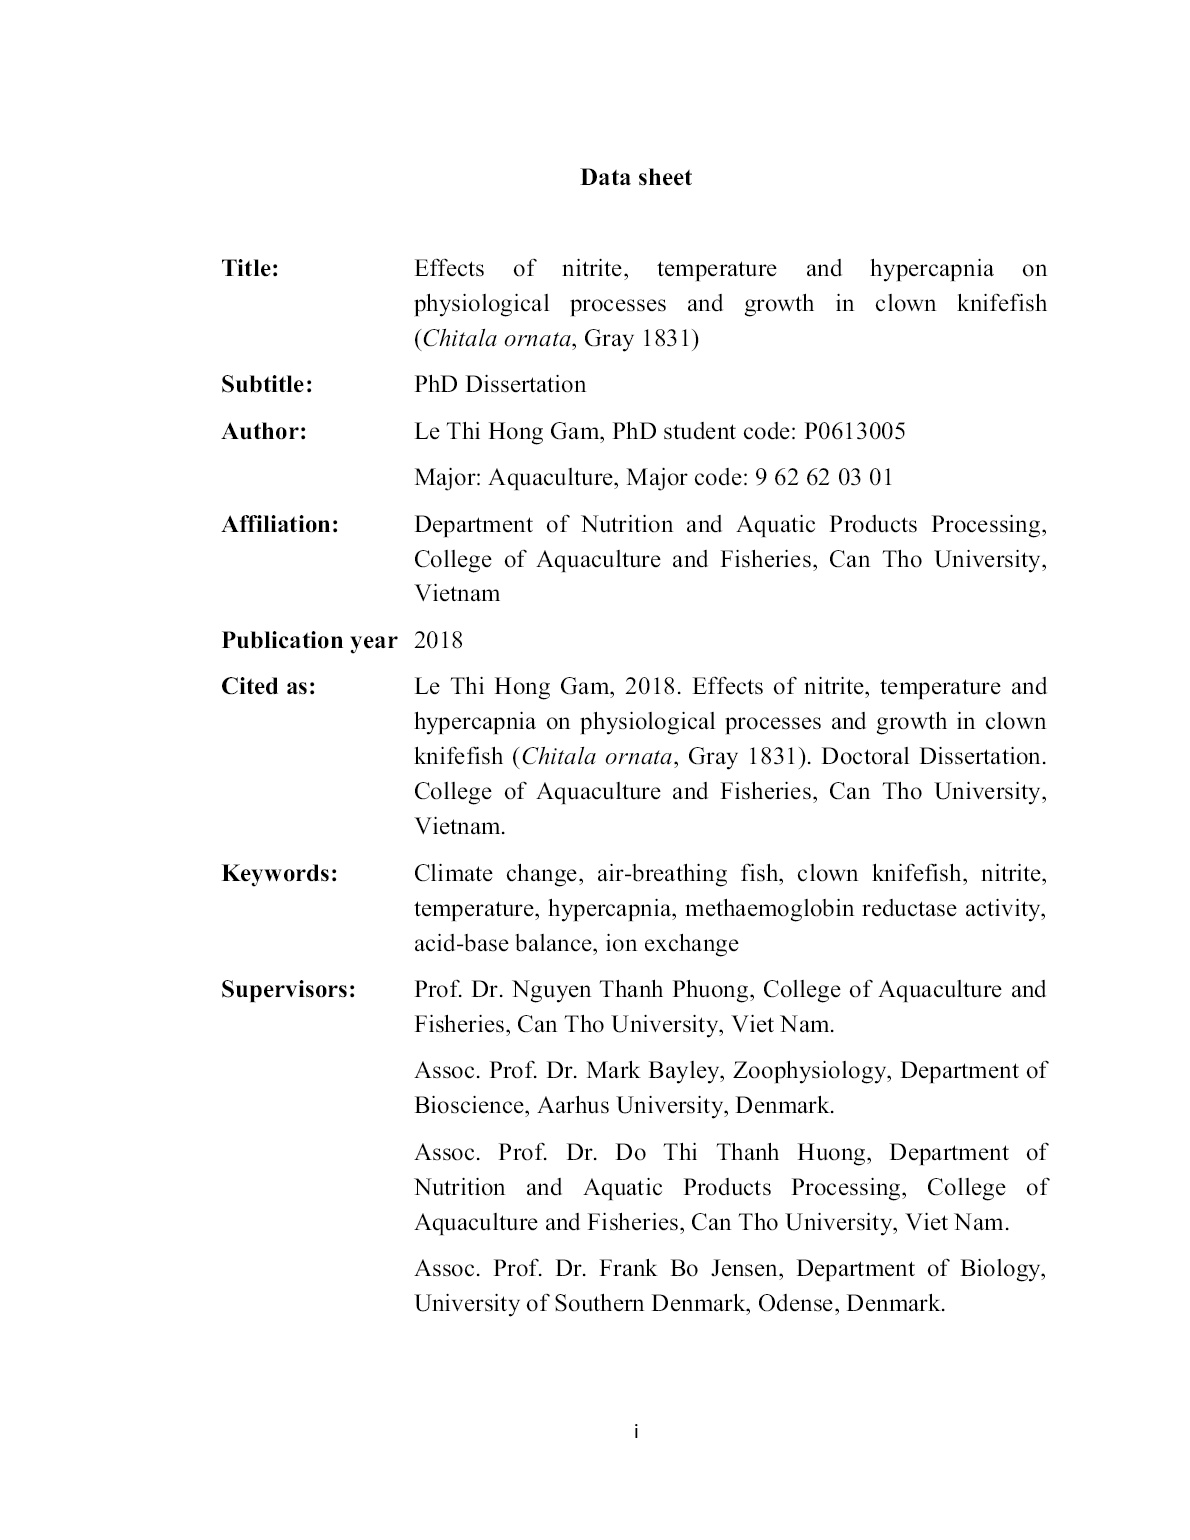
Luận án Effects of nitrite, temperature and hypercapnia on physiological processes and growth in clown knifefish (chitala ornata, gray 1831)
Trang 1
Trang 2
Trang 3
Trang 4
Trang 5

Trang 6
Trang 7
Trang 8
Trang 9
Trang 10
Tải về để xem bản đầy đủ
Bạn đang xem 10 trang mẫu của tài liệu "Luận án Effects of nitrite, temperature and hypercapnia on physiological processes and growth in clown knifefish (chitala ornata, gray 1831)", để tải tài liệu gốc về máy hãy click vào nút Download ở trên.
Tóm tắt nội dung tài liệu: Luận án Effects of nitrite, temperature and hypercapnia on physiological processes and growth in clown knifefish (chitala ornata, gray 1831)
cidosis, our study included 4
exposure groups: normocapnia (control), hypercapnia (PCO2 = 21 mmHg), 1 mM
nitrite, and combined hypercapnia (96 h acclimated hypercapnia) with nitrite, and
the hypothesis was evaluated by measuring Hb derivatives (functional Hb versus
metHb and HbNO), plasma nitrite and nitrate, plasma ions, plasma glucose and
acid-base status.
5.2 Materials and methods
5.2.1 Animal holding
C. ornata (body mass of 571±56.3 g) from a local intensive farm were
transported to Can Tho University. They were held at ambient laboratory
temperature 27-28ºC in 4 cubic meter tanks with constant aeration (dissolved
oxygen >90%) for 2 weeks before experimentation. Fish were fed by commercial
feed (shrimp feed with 38% protein, Tomboy Aquafeed company, Vietnam).
Thirty percent of tank water was changed every second day to maintain optimal
environmental condition (NO2- < 1 àM, NO3- < 40 àM and NH3 < 40 àM).
Feeding was stopped 2 days before starting the experiment. The experiment was
performed in accordance with national guidelines on the protection and care of
experimental in Vietnam.
74
5.2.2 Experimental protocols
A total of 24 fish (571±56.3 g) were used. They were anaesthetized in 0.05 g L-1
benzocaine and a polyethylene PE40 catheter (Smiths Medical International Ldt.,
Kent, UK) was inserted into the dorsal aorta through the dorsal side of the mouth
(Soivio et al., 1975), while the gills were irrigated with well-oxygenated water
containing 0.025 g L-1 benzocaine. Cannulation time was around 15-20 minutes
for each fish. Fish recovered in well-aerated water for 24 h before starting
experimentation to allow post-operative normalization of blood gasses (Phuong et
al., 2017a). The experimental set-up included a large 500 L tank from which
water was recirculated to 6 smaller 120 L tanks with 1 cannulated fish in each.
The water PCO2 was controlled with an Oxyguard Pacific system coupled with a
G10ps CO2 probe and a K01svpld pH probe (Oxyguard International A/S, Farum,
Denmark), which supplied CO2 to the water when pH changed above a value
corresponding to the desired PCO2 in the water. There were 4 exposure groups:
(i) normocapnia (PCO2 < 0.7 mmHg); (ii) hypercapnia (PCO2 = 21 mmHg); (iii) 1
mM nitrite in normocapnic water and (iv) combined hypercapnia (acclimated
hypercapnia) and 1mM nitrite. In this combined group, the fish were cannulated
then acclimated to hypercapnia (21 mmHg CO2) for 96 h before adding 1 mM
nitrite. Water temperature was controlled at 27-28ºC throughout experiments and
water PO2 was above 120 mmHg. Nitrite was added as NaNO2 and tested after
each sampling time. During the exposures, a volume of 0.8 mL blood was
withdrawn from the catherter at 0, 3, 6, 24, 48, 72 and 96 h. The blood was
divided into two parts. Half was used immediately for measurements of Hct, pHe,
PCO2, and Hb derivatives (see below). The remainder of the blood was
centrifuged (6 min at 6,000g), and the plasma was stored at -80°C for subsequent
analysis of ions and osmolality.
5.2.3 Analytical procedures
Plasma nitrite was determined spectrophotometrically at 540 nm (Varian Cary 50
Spectrophotometer, Varian Inc.) using the Griess reaction (Lefevre et al., 2011a;
Hvas et al., 2016). Plasma nitrate was measured similarly after reducing nitrate
to nitrite with vanadium (III) chloride (Hvas et al., 2016; Lefevre et al., 2011a;
Miranda, 2001). Plasma Na+ and K+ were measured by flame photometry
(Sherwood Model 420). Plasma Cl- concentrations were measured with a
chloride titrator (Sherwood model 926S MK II Chloride analyzer, Sherwood
Science Ltd., Cambridge, UK). Total plasma osmolality was measured on a Fiske
75
one-ten osmometer (Fiskeđ Associates, Two Technology Way, Norwood,
Massachusetts, USA).
For Hb derivatives, 15 àL of blood was mixed with 1.5 mL phosphate buffer
(0.02 M, pH 7.3) and centrifuged in 3 min at 18,000g. The supernatant was
transferred into a cuvette and measured with a spectral scan in 0.5 nm steps from
480 to 700 nm. The concentrations of oxyHb, metHb, HbNO and deoxyHb were
determined by spectral deconvolution, following the procedure described in
Jensen (2007), Lefevre et al. (2012), Hvas et al. (2016), using reference spectra
prepared from C. ornata blood (Gam et al., 2017). Total Hb was calculated from
the sum of the derivatives, and functional [Hb] was calculated as {[oxyHb] +
[deoxyHb]}/total [Hb].
Blood pHe and PCO2 were measured with an iSTAT analyzer (iSTAT
Corporation, Princeton, USA) with CG3+ cartridges. The in vitro non-
bicarbonate buffer curve and buffer value (òNB) were determined in separate
experiments by equilibrating 5 mL blood from fish (ten fishes for ten replicates)
in an Eschweiler tonometer with different mixtures of air and CO2 using a gas-
mixing pump (Wửsthoff, Bochum, Germany). The oxygenated blood was
equilibrated with 7, 14 and 21 mmHg CO2 for 45 minutes to reach complete
equilibration of the blood with gas mixture. The values for pHe and pCO2
generated by the iSTAT analyzer were temperature compensated to the fish
temperature, using the equations from the iSTAT manual. [CO2]total) was
measured by the Cameron micro method (Cameron, 1971). It should be noted
here that while the temperature corrected iSTAT values were found to be
accurate for pH in trout blood at 10°C and 20°C, it was found to be highly
inaccurate for other blood gas values including pCO2 under these conditions,
particularly at low PCO2 (Harter et al., 2014). In contrast the system has been
found to provide accurate readings of PCO2 at higher temperature (30°C) in
P.hypophthalmus blood equilibrated with known PCO2 levels using tonometry
(Damsgaard et al., 2015). The differences in accuracy probably reflect
differences in temperature since the system is designed for mammalian blood gas
analysis. Bicarbonate concentrations were subsequently calculated using the
following equation:
[HCO3-] = [CO2]total - PCO2 * αCO2 ,
where αCO2 is CO2 solubility in trout plasma (Boutilier et al., 1985).
76
5.2.4 Statistics
All figures were made in Sigma plot 12.5. All data were analyzed with PASW
statistics (SPSS 18). A two - way ANOVA (the Holm-Sidak multiple comparison
method, pair-wise comparison) was used to identify differences between
sampling times and treatments and sampling times. Normal distribution was
tested using the Shapiro-Wilk test. A p value of less than 5% (p<0.05) was judged
significant. All data are shown as mean±SEM.
5.3 Results
5.3.1 Acid-base parameters and plasma ions
Hypercapnia caused arterial PCO2 to increase, leading to an acute decrease of
arterial pHe by 0.35 units after 3 h, where after pHe slowly recovered to attain
half- compensation by 96 h (p<0.05) (Fig. 5.3.1.1A). This pH recovery was
associated with a significant increase in plasma HCO3- by 10 mM (Fig. 5.3.1B).
Exposure to nitrite alone induced a temporary small decrease in pHe that
recovered to control values at 96 h (Fig. 5.3.1.1A). This temporary acidosis was
caused by a small increase in arterial PCO2 (Fig. 5.3.1.1D) and was modulated by
a small increase in plasma HCO3- (Fig. 5.3.1.1B). In the combined hypercapnia
and nitrite group, arterial pHe, PCO2 and [HCO3-] at time 0 were similar to values
in the hypercapnia group at 96 h, and while pHe and PCO2 remained relatively
stable, there was a significant increase in HCO3- with time (Fig. 5.3.1.1A,B,D).
Plasma [Cl-] decreased strongly during pH regulation in the hypercapnia group
and was also significantly decreased during exposure to nitrite (Fig. 5.3.1.1C). In
the combined hypercapnia and nitrite group, on the other hand, [Cl-] started out at
a lowered value and subsequently stayed relatively stable (Fig. 5.3.1.1C). In the
normocapnic control groups all acid base and ionic parameters stayed constant
over the 96 h experiment (Fig. 5.3.1.1).
Plasma sodium decreased significantly for 48 h in the nitrite group, where after a
small incomplete recovery of Na+ was observed (Fig. 5.3.1.1E). A similar change
occurred in the combined hypercapnia and nitrite group, but the decline in Na+
was smaller (Fig. 5.3.1.1E). Hypercapnia alone also caused a small decrease in
Na+ (Fig. 5.3.1.1E). These decreases in plasma Cl- and Na+ were accompanied
with a significant drop in plasma osmolality (Fig. 5.3.1.1F). Thus both exposure
to hypercapnia and exposure to nitrite were associated with decreased osmolality.
Plasma K+ concentrations were significantly elevated at intermediate exposure
77
times (24 h and 48 h) in all exposure groups, but the values recovered to control
values at 96 h (p<0.05) (Table 5.3.1). A similar tendency was present for plasma
glucose (Table 5.3.1.1).
Fig. 5.3.1.1. Time-dependent changes in pHe (A), plasma HCO3
- (B), plasma Cl- (C),
PCO2 (D), plasma Na
+ (E), and plasma osmolality (F) during exposure to normocapnia
(open circles), hypercapnia (21 mmHg CO2, closed circles), 1 mM nitrite (open
78
triangles), and acclimated hypercapnia and nitrite (closed triangles). Asterisks show
significant difference from 0 h within treatment and plus signs show significant
difference to controls at a sampling time. Showed data are mean±SEM (n=6).
79
Table 5.3.1.1 Plasma K+, plasma glucose during exposures to hypercapnia and nitrite.
Asterisks show significant difference from 0 h within treatment and plus signs show significant difference to controls at a
sampling time. Showed data are mean±SEM (n=6).
K+ (mM) 0 h 3 h 6 h 24 h 48 h 72 h 96 h
Control 3.46±0.14 3.90±0.09 4.53±0.10*,+ 5.49±0.12*,+ 5.13±0.13*,+ 4.19±0.12*,+ 3.89±0.13
21 mmHg CO2 3.46±0.14 3.90±0.09 4.53±0.10*,+ 5.49±0.12*,+ 5.13±0.13*,+ 4.19±0.12*,+ 3.89±0.13
1 mM NO2- 3.69±0.21 3.54±0.25 3.97±0.31 4.51±0.38*,+ 4.41±0.39*,+ 3.31±0.44 3.10±0.37
21 mmHg CO2 +1 mM NO2- 3.85±0.11 3.80±0.09 5. 33±0.17*,+ 5.96±0.23*,+ 4.62±0.21* 3.44±0.20 3.44±0.12
Plasma glucose (mM) 0 h 3 h 6 h 24 h 48 h 72 h 96 h
Control 1.16±0.01 1.13±0.01 1.21±0.02 1.15±0.02 1.16±0.03 1.19±0.02 1.20±0.01
21 mmHg CO2 1.24±0.01 1.48±0.02*,+ 1.53±0.01*,+ 2.05±0.02*,+ 2.04±0.02*,+ 1.83±0.02*,+ 1.58±0.01*,+
1 mM NO2- 1.18±0.02 1.12±0.02 1.35±0.02 1.52±0.04*,+ 1.62±0.02*,+ 1.52±0.02*,+ 1.37±0.02
21 mmHg CO2 +1 mM NO2- 1.21±0.01 1.54±0.02*,+ 1.61±0.03*,+ 1.33±0.01 1.45±0.02 1.47±0.04+ 1.41±0.04
80
81
The changes in acid-base status in the different exposure groups are illustrated in
a Davenport diagram depicting the in vitro buffer line with a βNB of 21.4 slykes
(Fig. 5.3.1.2). Hypercapnia led to an acute pH decrease along the buffer line
followed by metabolic pHe compensation via HCO3- accumulation along the
PCO2 ~ 21 mmHg isocline, reaching half-compensation by 96 h. In the combined
hypercapnia and nitrite group a further increase in bicarbonate occurred. During
exposure to nitrite alone there was a minor respiratory acidosis for some 24 h that
subsequently became rectified by a small elevation of HCO3- (Fig. 5.3.1.2)
Fig. 5.3.1.2. Davenport diagram showing changes in acid-base status during exposure to
normocapnia (open circles), hypercapnia (21 mmHg CO2, closed circles), 1 mM nitrite
(open triangles), and acclimated hypercapnia and nitrite (closed triangles). The dashed
line is the non-bicarbonate buffer curve determined in vitro. Showed data are means±
SEM (n=6).
5.3.2 Nitrite uptake and levels of Hb derivatives
Nitrite exposure was associated with nitrite uptake in the plasma, but plasma NO2-
increased significantly less during nitrite exposure in hypercapnia than in
normocapnia (Fig. 5.3.2A). Plasma NO2- was maintained below ambient [nitrite]
throughout the exposures and the maximal plasma nitrite values of 0.6 mM
82
(nitrite group) and 0.39 mM (hypercapnia + nitrite) were reached after 48 h, after
which plasma NO2- decreased towards controls (Fig. 5.3.2A). The nitrite uptake
induced a rise of blood metHb to 26% (nitrite group) and 14% (hypercapnia +
nitrite) of total Hb after 48 h, whereupon metHb levels slowly decreased (Fig.
5.3.2B). Despite lower maximal metHb levels during exposure to combined
hypercapnia and nitrite than nitrite alone, the rate of metHb formation was
highest during the initial hours of nitrite exposure in hypercapnia (Fig. 5.3.2B).
HbNO levels rose to 5% and 4% of total Hb (Fig. 5.3.2C) in the two nitrite
exposure groups. The increases in metHb and HbNO led to a significant reduction
in functional Hb to 70% and 83% of total Hb in the nitrite and combined
hypercapnia and nitrite groups, respectively (Fig. 5.3.2D) (p<0.05).
Plasma NO3- significantly increased, reaching 3.8 mM and 2.5 mM in 96 h in the
nitrite and combined hypercapnia and nitrite groups, respectively (Fig. 5.3.2E).
The sum of plasma nitrite and nitrate (Fig. 5.3.2F) is a good indicator of the total
uptake of nitrite, as nitrate is formed by oxidation of nitrite (e.g. in the reaction
between nitrite and oxyHb). The sum of plasma nitrite and nitrate increased
continuously with time during the exposures, but the total uptake was
significantly lower in the hypercapnia plus nitrite group than in the nitrite group
(Fig. 5.3.2F). There were only moderate changes in Hct, Hb, and MCHC in the
four experimental groups (Table 5.3.1.2).
83
Table 5.3.1.2 Hct, Hb and MCHC during exposures to hypercapnia and nitrite.
Asterisks show significant difference from 0 h within treatment and plus signs show significant difference to controls at a sampling
time. Showed data are mean±SEM (n=6).
Hct (%) 0 h 3 h 6 h 24 h 48 h 72 h 96 h
Control 30.55±0.12 30.15±0.21 30.30±0.23 30.15±0.13 30.92±0.18 30.55±0.10 30.53±0.18
21 mmHg CO2 30.93±0.12 28.84±0.16*,+ 31.83±0.15*,+ 33.37±0.14*,+ 30.05±0.13*,+ 30.01±0.19* 31.09±0.16
1 mM NO2- 30.87±0.15 29.24±0.15* 27.41±0.14*,+ 27.8±0.19*,+ 27.04±0.20*,+ 25.55± 0.18*,+ 25.62±0.15*,+
21 mmHg CO2 +1 mM NO2- 31.93±0.15+ 29.35±0.13* 30.98±0.14*,+ 29.07±0.11*,+ 29.10±0.10*,+ 28.47±0.12*,+ 25.77±0.13*,+
Hb (mM) 0 h 3 h 6 h 24 h 48 h 72 h 96 h
Control 5.77±0.06 5.92±0.10 5.90±0.13 5.72±0.08 5.80±0.09 5.73±0.09 5.81±0.08
21 mmHg CO2 6.38±0.10+ 5.70±0.09* 6.18±0.14 6.01±0.10 5.86±0.09* 5.85±0.08* 6.27±0.09
1 mM NO2- 5.51±0.08 5.82±0.08 5.64±0.11 4.85±0.15*,+ 5.01±0.07*,+ 5.09±0.10+ 5.20±0.09+
21 mmHg CO2 +1 mM NO2- 6.18±0.12+ 5.39±0.15*,+ 5.42±0.11*,+ 5.3 ±0.09* 5.10±0.09*,+ 4.87±0.07*,+ 5.07±0.14*,+
MCHC (mM) 0 h 3 h 6 h 24 h 48 h 72 h 96 h
Control 18.88±0.14 19.64±0.19* 19.51±0.30* 18.99±0.16 18.75±0.16 18.78±0.16 18.67±0.32
21 mmHg CO2 20.65±0.21+ 19.75±0.13* 19.4±0.24* 18.00±0.18*,+ 19.49±0.17*,+ 19.49±0.04*,+ 20.16±0.20
1 mM NO2- 17.86±0.16+ 19.99±0.14* 20.63±0.18*,+ 17.68±0.19+ 18.73±0.18* 20.71±0.24*,+ 20.41±0.16*,+
21 mmHg CO2 +1 mM NO2- 19.34±0.21 18.40±0.28*,+ 17.52±0.21*,+ 18.49±0.17*,+ 17.54±0.17*,+ 17.10±0.14*,+ 19.66±0.26+
 84
Fig. 5.3.2. Time-dependent changes in plasma NO2
- (A), metHb percentage (B), HbNO
percentage (C), functional Hb (D), plasma NO3
- (E), and the sum of plasma nitrite and
nitrate (F) during exposure to normocapnia (open circles), hypercapnia (21 mmHg CO2,
 85
closed circles), 1 mM nitrite (open triangles), and acclimated hypercapnia and nitrite
(closed triangles). Showed data are means±SEM (n=6).
5.4 Discussion
This study supports our hypothesis that environmental hypercapnia will reduce
branchial nitrite uptake via the branchial Cl-/HCO3 exchanger, since regulation of
a respiratory acidosis causes a slowing of Cl- uptake via the exchanger and hence
also reduces nitrite uptake. Thus the response of C. ornata to this combined
exposure resembles that of the crayfish Astacus astacus (Jensen et al., 2000), but
is different to that seen in the air-breathing teleost P. hypothalamus, where nitrite
uptake is only transiently decreased and subsequently increases (Hvas et al.,
2016). These authors argued that when pHe in P. hypophthalmus regulates, the
resultant elevated plasma HCO3- could drive a supra-normal Cl-/HCO3- exchange
rate and hence an elevated nitrite uptake rate.
To evaluate the present data it is necessary first to evaluate general aspects of
acid-base regulation of the extracellular space in C. ornata. It has been suggested
that air-breathing fishes are generally unable to effectively regulate extracellular
pH during respiratory acidosis (Shartau and Brauner, 2014), which the authors
argued was a result of reduced gill surfaces and reduced branchial irrigation
resulting from the shift to air-breathing. The exception to this trend to date is P.
hypothalamus, which shows an extreme capacity for extracellular acid-base
regulation, where complete regulation was seen after 72 h in aquatic hypercapnia
with a PCO2 of 34 mmHg (Damsgaard et al., 2015). This species incidentally
possesses very large gills and hence presumably a large ion-exchange surface
area gills (Phuong et al., 2017b; 2017c). Further, P. hypothalamus shows for
freshwater fish, an unusual mechanism of acid-base regulation during the initial
stages of compensation of respiratory acidosis. Hvas et al. (2016) argued that
during the initial compensatory phase, modulation of branchial Na+/H+ exchange
dominated over Cl-/HCO3- exchange. There is no evidence of such initial Na+-
mediated acid-base regulation in the present study. Further, in terms of prowess at
compensating respiratory acidosis, C. ornata, which shows 50% pH
compensation after 96 h in an aquatic PCO2 of 21 mmHg is less proficient than P.
hypophthalmus (Damsgaard et al., 2015) which can fully compensate after 72h.
However, C. ornata is more proficient than other air-breathing fish including the
south American lungfish Lepidosiren paradoxa (Sanchez et al., 2005) the bowfin
Amia calva (Brauner and Baker, 2009) , the armoured catfish Lipocar pardalis
 86
(Brauner et al., 2004) and the marbled swamp eel Synbranchus marmoratus
(Heisler, 1982). Heisler, 1986 argued that freshwater fish are unable to increase
plasma HCO3- beyond 25-35 mM due to limits in the capacity for accumulation of
bicarbonate. This has also been argued as the reason that most water breathing
fish are unable to completely regulate a respiratory acidosis from environmental
hypercapnia in excess of 10-15 mmHg CO2 (Brauner and Baker, 2009). The
degree of pH compensation varies among species, but is also dependent on water
ionic composition and on time, resulting in slower and less complete acid-base
compensation in soft and ionic poor water than in hard and ionic rich water
(Larsen and Jensen, 1997). The present water has relatively low ionic content,
although not extremely soft (Li and Bush, 2015), and the pHe compensation in C.
ornata was 50% after 96 h, but extracellular [HCO3-] seems to be on a slow rising
trajectory beyond that point (Fig. 5.3.1.1), meaning that acid-base regulation
continues. It is therefore likely that there is a continued suppression of Cl-/HCO3-
exchange during the combined exposure. Indeed, in the combined hypercapnia
and nitrite exposure group, plasma HCO3- increased to higher levels than seen in
the hypercapnia alone group, supporting our hypothesis that pHe regulation was
slow in this species and that hypercapnia caused a reduction in HCO3-/Cl-
exchange well beyond 96 h. While, reduced Cl-/HCO3- exchange activity at the
branchial surfaces provides the most parsimonious explanation for the reduction
in nitrite uptake observed during exposure in the combined group, it is worth
considering other possibilities. Reductions in branchial ventilation or metabolic
rate might have reduced nitrite uptake as would a shift to air-breathing. While
high levels of methemoglobin will inevitably c
File đính kèm:
 luan_an_effects_of_nitrite_temperature_and_hypercapnia_on_ph.pdf
 Thông tin luận án_TiengAnh_Gam.docx
 Thông tin luận án_TiengViet_Gam.docx
 Toamtatluanan_vi.pdf
 Tomtatluanan_en.pdf

