Luận án Nghiên cứu hiện tượng chuyển pha trong vùng hoạt lò phản ứng
Trang 1
Trang 2
Trang 3
Trang 4
Trang 5
Trang 6
Trang 7
Trang 8
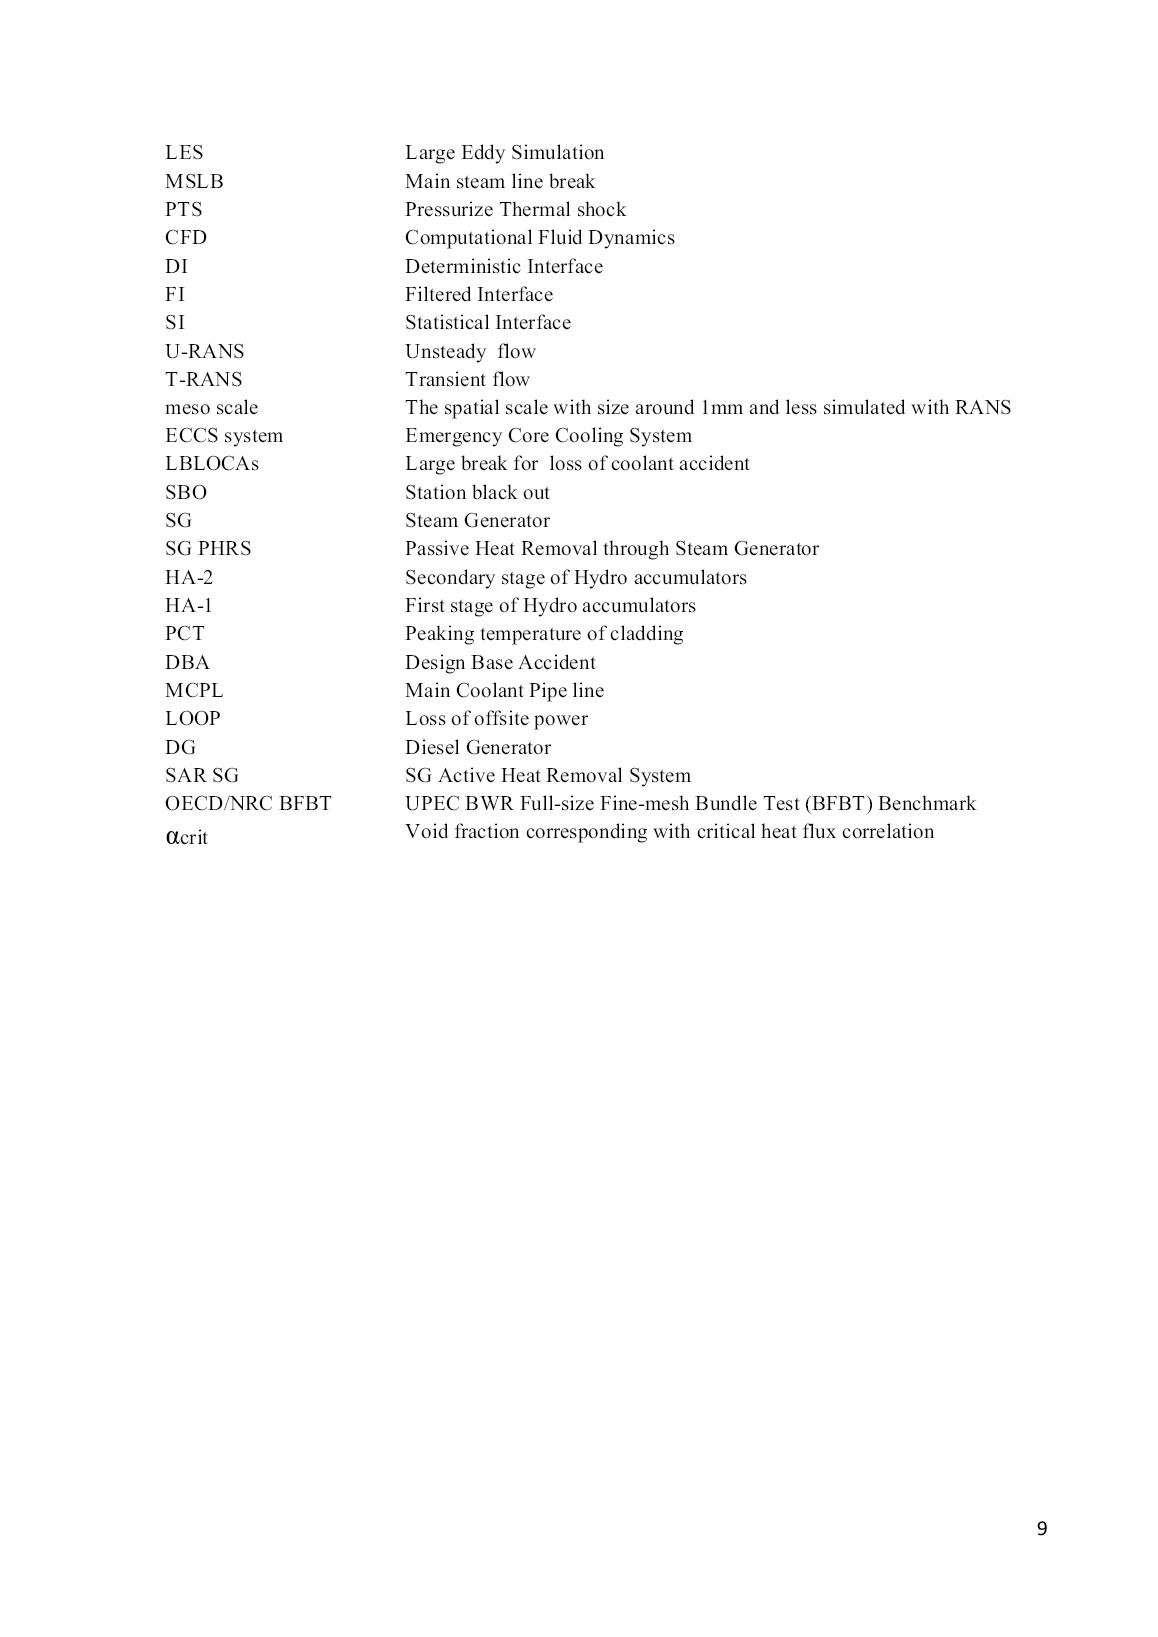
Trang 9
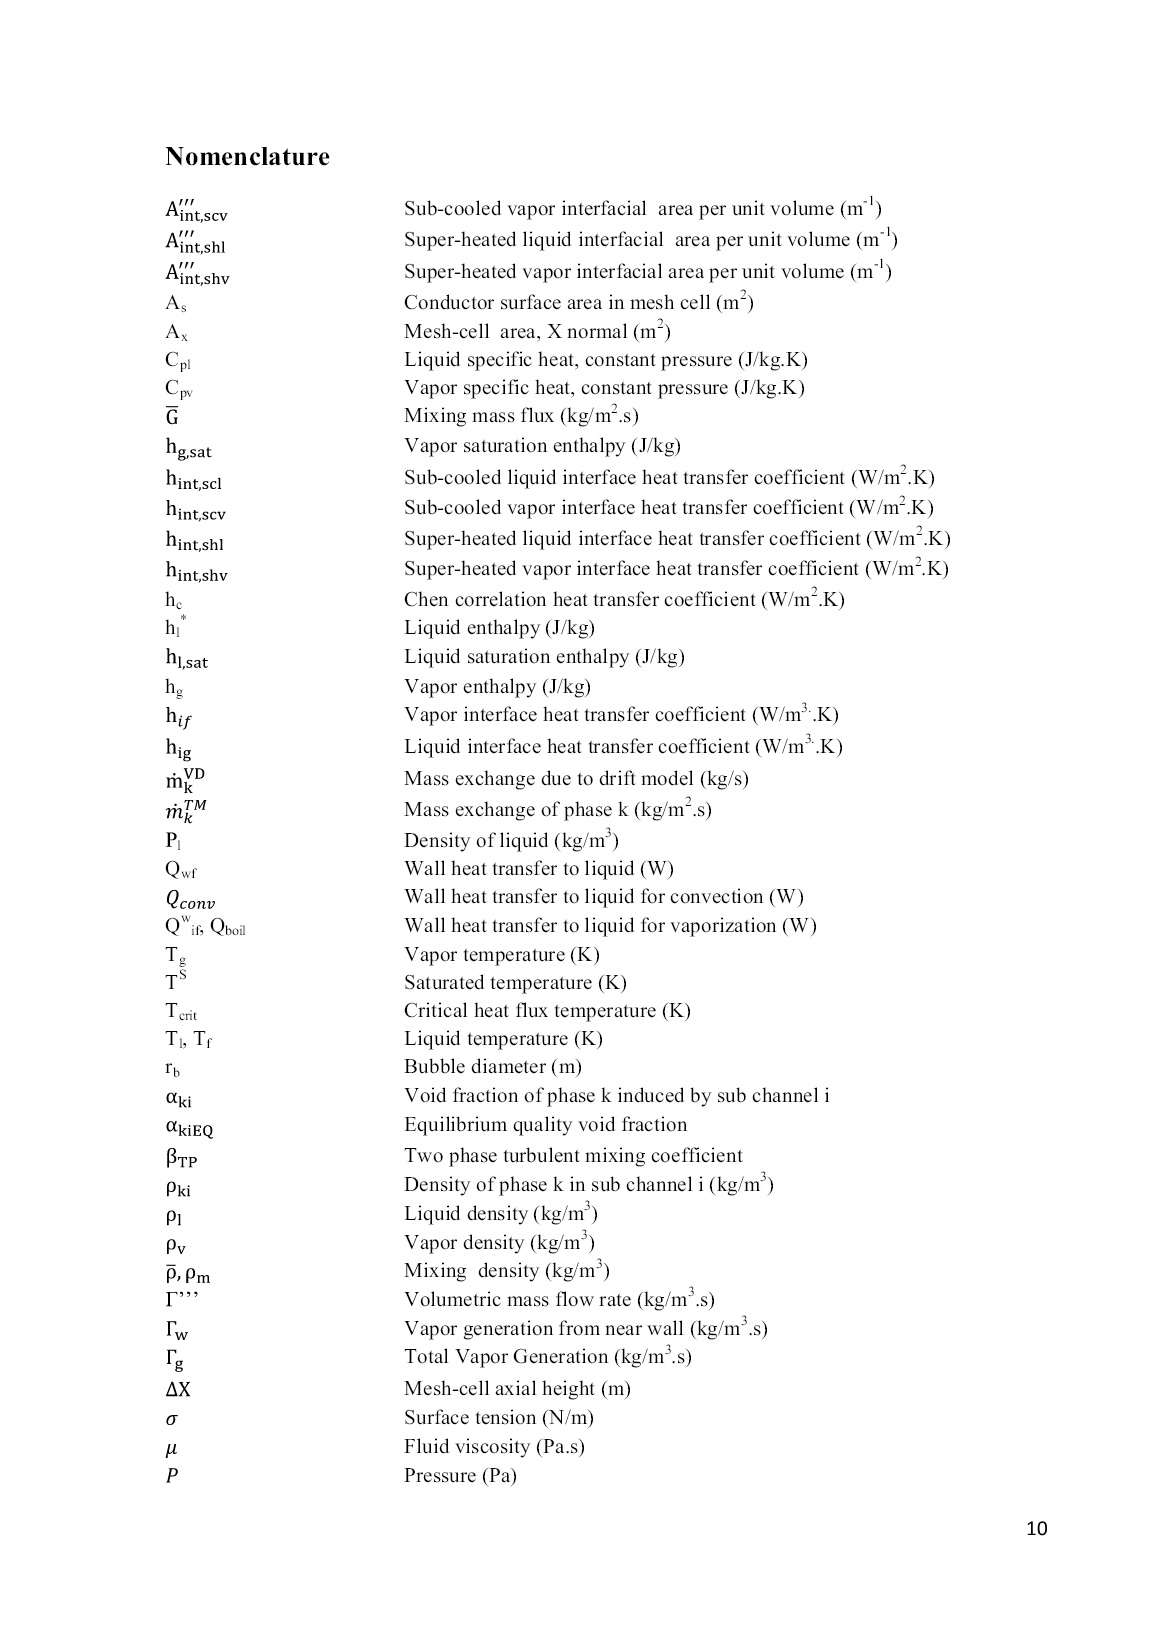
Trang 10
Tải về để xem bản đầy đủ
Bạn đang xem 10 trang mẫu của tài liệu "Luận án Nghiên cứu hiện tượng chuyển pha trong vùng hoạt lò phản ứng", để tải tài liệu gốc về máy hãy click vào nút Download ở trên.
Tóm tắt nội dung tài liệu: Luận án Nghiên cứu hiện tượng chuyển pha trong vùng hoạt lò phản ứng
15 63.00 Termination of boron solution injection into the reactor from HA-1 63.00 Termination of boron solution injection into the reactor from HA-1 0 117.00 Beginning of supply from HA-2 115.00 Beginning of supply from HA- 2 2 500.00 End of the calculation 500.00 End of the calculation 0 51 The graph on the left of Figure 3.4 shows cladding temperature of the calculation at the hot channel with different location of break and the graph at the right of Figure 3.4 shows SAR calculation with different sensitivity study. Figure 3.4 (a) Cladding temperature from calculations, (b) Cladding temperature from SAR Thus, the comparison results of steady-state and DBA with Event number 3 mentioned above shown that deviation of results in Table 3.3 and Table 3.4 have no significant gap. The graphs in Figure 3.4 also show our calculation similar to SAR results in term of peaking cladding temperature and timing to cool down cladding temperature. Thus, the simulation model of this study is appropriate with reference model from the SAR. 3.3 CTF models verification and assessment with BM ENTEK tests As mentioned in Ref. [26], the study of CTF void fraction prediction for PSBT single channel exercises shows that CTF predictions stay within the error bound of 0.1 void. The conclusion in Ref. [29] shows that the heat transfer models in CTF were inappropriate for simulations of subcooled boiling conditions. It is necessary to validate CTF void fraction prediction with an experiment in high pressure condition to verify its accuracy and the ENTEK BM tests suitable for this study. CTF, a COBRA-TF version with inhomogeneous models of two phase flow, is developed by Pennsylvania State University and is transferred to Vietnam Agency for Radiation and Nuclear Safety (VARANS) through bilateral cooperation. Therefore, CTF is considered as a tool at sub channel scale to investigate core thermal hydraulics by technical support organizations (TSOs). This study focuses on two points: (a) accuracy assessment between CTF’s void fraction predictions versus experiment distributions along the channel and (b) uncertainty of void fraction prediction due to propagation of input uncertainty caused by measured accuracy. 3.3.1 ENTEK BM facility As mentioned in [33], Figure 3.5 provides a vertical and cross-section view of the test section which is also called as Heated Release Zone (HRZ). For the cross section view, the diameters are shown in millimeters. The HRZ contains a 7-rod bundle made by stainless steel (X18H10T). All the rods are hollow with outer diameter of 13.5 mm, 1.25 mm wall thickness, and 7 m length. The bundle is contained within a stainless steel pressure tube (80 mm outer diameter and 5 mm wall thickness) with inner diameter of 49 mm and 10.5 mm wall 52 thickness. The coolant flow area is 8.84×10 -4 m 2 and the hydraulic diameter is 7.84 mm. There are 20 honeycomb-type pin spacing grids along the length of the HRZ, starting 30 mm from the beginning of the HRZ and repeated every 350 mm. Thus, these spacing grids are similar to the spacers in the RBMK-1000 with a hydraulic loss coefficient of 0.4 based on measurements. The uncertainties of the measurements for each parameter are following for all tests: - Pressure at HRZ outlet: ±1.5 %; - Coolant mass flow rate : ±0.0018 kg/s; - Coolant temperature at HRZ inlet: ±1 K; - Electrical power: ±2 kW; - Void fraction: ±0.03; (void is calculated rather than measured). Figure 3.5 Test section (Heat Release Zone, φ is diameter in mm) with vertical and cross section view (source [33]). The test section, called Heat Release Zone, is illustrated from point “B” to point “C” in the Figure 3.5. Measurement readings were obtained at 10 axial locations (i.e., 0.385, 0.948, 1.573, 2.322, 2.947, 4.010, 4.823, 5.448, 6.135, and 6.760 m from bottom of heated length) by moving the equipment during a test. The density was converted to a void fraction ( ) using the formula: The report [33] presents 25 tests together with RELAP5 calculation results. Since the input parameters such as pressure, mass flow rate, power and temperature are somehow not consistent with behavior of a flow because they are not measured at the same time in 10 locations along the channel in test section, but measured in sequence during the test, then to simulate this test it is essential to setup base case for simulation and to perform sensitivity analysis. 53 3.3.2 Modeling by CTF Figure 3.6 shows the CTF modeling of BM ENTEK with 12 channels numbered from 1 to 12 at the left and 18 gaps numbered from 1 to 18 at the right. The geometry data is taken from the Ref. [33] and the initial data is taken from tests presented in Table 3.5. 3.3.3 Results and discussions Setting for base case and sensitivity analysis Ten tests were selected to study. The tests: T01, T04, T08, T10 and T14 were implemented at pressure of 3 MPa. The five other tests: T17, T18, T22, T24 and T25 are performed at pressure of 7 MPa. The input for base case is selected by the average values of input parameters measured at ten locations. The sensitive study includes two cases for each test. The first is maximum voiding case by selection of maximum pressure, mass flow rate and minimum power and temperature measured. The second is minimum voiding case by selection of minimum pressure, mass flow rate and maximum power, temperature. Figure 3.6 BM ENTEK modeling by CTF Table 3.5 Setting for base case and sensitivity cases according to test 01 and test 17 Test No P (MPa) G (kg/s) N (kW) T (K) Z (m) Void exp T01 3.13 0.4364 305.6 373 0.385 0.0 3.16 0.4353 305.1 388 0.948 0.0 3.16 0.4344 305.1 388 1.573 0.0 3.11 0.4336 300.8 389 2.322 0.0 3.06 0.4481 302.3 389 2.947 0.0 3.13 0.4403 296.7 389 4.010 0.0 3.08 0.4339 296.8 388 4.823 0.027 3.11 0.4389 297.0 388 5.448 0.178 3.13 0.4344 297.8 388 6.135 0.493 3.09 0.435 296.0 388 6.760 0.635 Base case 3.12 0.4370 303 387 Min void 3.16 0.4389 296 373 Max void 3.06 0.4336 305.6 389 54 T17 7.21 0.8956 308.0 496 0.385 0.0 7.22 0.8794 303.1 498 0.948 0.004 7.24 0.8797 302.4 501 1.573 0.006 7.09 0.8722 303.3 494 2.322 0.0 7.11 0.8825 301.6 494 2.947 0.009 7.18 0.8853 302.1 496 4.010 0.002 7.20 0.8781 301.4 497 4.823 0.017 7.17 0.8814 302.0 497 5.448 0.033 7.16 0.8822 301.6 494 6.135 0.079 7.16 0.8850 302.2 493 6.760 0.194 Base case 7.17 0.8821 302.8 496 Min void 7.24 0.8956 301.4 493 Max void 7.09 0.8722 301.4 501 For remaining tests, the experiment data can be found in [33] and the base case setting and sensitivity cases are similar to Table 3.5. Along channel void fraction distribution discussion Table 3.6 and Table 3.7 show the void fraction distribution calculation results versus experiment distribution along the channel. Table 3.8 shows the difference between void fraction distribution calculation results versus experiment distribution. It is observed that CTF’s void fraction distribution predictions for base cases are good agreement with experiment distribution with mainly deviation around 0.03 of void. The maximum deviations with value around 0.1 occurred just one or two locations of the tests T04 and T08. Especially, for the five tests at 7 MPa (T17, T18, T22, T24 and T25), the very good void fraction distribution calculations are agreed with experiment distribution with deviation not more than 0.03 void along the channel. Table 3.6 Base case void fraction distribution calculations versus experiment for cases at 3MPa. Z T01x T01c T04x T04c T08x T08c T10x T10c T14x T14c 0.385 0 0 0 0 0.003 0 0 0 0.002 0 0.948 0 0 0.006 0 0.01 0 0.001 0 0.001 0 1.573 0 0 0.015 0 0.001 0 0.006 0 0 0 2.322 0 0 0 0 0 0 0 0 0 0 2.947 0 0 0.002 0 0 0 0.006 0 0 0 4.01 0 0 0.002 0 0.206 0.088 0.165 0.067 0.24 0.183 4.823 0.027 0.003 0.043 0.022 0.621 0.574 0.398 0.342 0.484 0.441 5.448 0.178 0.155 0.136 0.157 0.756 0.759 0.541 0.608 0.594 0.588 6.135 0.493 0.591 0.299 0.459 0.83 0.842 0.652 0.723 0.646 0.673 6.76 0.635 0.706 0.472 0.584 0.86 0.877 0.74 0.771 0.718 0.714 (x = Experiment, c= Calculation) Table 3.7 Base case void fraction distribution calculations versus experiment for cases at 7MPa. Z T17x T17c T18x T18c T22x T22c T24x T24c T25x T25c 0.385 0 0 0 0 0.001 0 0 0 0 0 0.948 0.004 0 0.003 0 0.018 0 0 0 0 0 1.573 0.006 0 0 0 0.015 0 0 0 0 0 2.322 0 0 0.009 0 0.085 0.03 0 0 0 0 2.947 0.009 0 0.089 0.005 0.22 0.134 0 0 0 0 4.01 0.002 0 0.275 0.179 0.446 0.496 0.1027 0.076 0 0.001 4.823 0.017 0 0.405 0.381 0.579 0.616 0.2814 0.25 0.1548 0.123 55 5.448 0.033 0 0.485 0.503 0.654 0.694 0.3973 0.406 0.4021 0.364 6.135 0.079 0.056 0.553 0.585 0.733 0.75 0.4834 0.512 0.5178 0.591 6.76 0.194 0.17 0.612 0.628 0.79 0.781 0.5585 0.564 0.6398 0.67 It is found that CTF tends to give under prediction when experiment void fraction below 0.2 corresponding with heat transfer in sub cooled boiling mode and flow regime map in small bubble. At the near outlet of the channel where the experiment void is more above 0.2 and heat transfer in nucleate boiling mode, CTF tends to give over prediction. Thus, CTF boiling model is still needed to be improved for both sub cooled and nucleate boiling regimes in order to generate more void in sub cooled region and reduce void at nucleate boiling region. Table 3.8 Deviation of void fraction distribution calculation results versus experiment Z D(T01)* Heat mode D(T04) Heat mode D(T08) Heat mode D(T10) Heat mode D(T14) Heat mode 0.385 0 spl 0 spl -0.003 spl 0 spl -0.002 spl 0.948 0 spl -0.006 spl -0.01 spl -0.001 spl -0.001 spl 1.573 0 spl -0.015 spl -0.001 spl -0.006 spl 0 spl 2.322 0 spl 0 spl 0 spl 0 spl 0 subc 2.947 0 spl -0.002 spl 0 spl -0.006 spl 0 subc 4.01 0 spl -0.002 subc -0.118 subc -0.098 subc -0.057 nucb 4.823 -0.024 subc -0.021 subc -0.047 nucb -0.056 nucb -0.043 nucb 5.448 -0.023 subc 0.021 nucb 0.003 nucb 0.067 nucb -0.006 nucb 6.135 0.098 nucb 0.16 nucb 0.012 nucb 0.071 nucb 0.027 nucb 6.76 0.071 nucb 0.112 nucb 0.017 nucb 0.031 nucb -0.004 nucb Z D(T017) Heat mode D(T18) Heat mode D(T22) Heat mode D(T24) Heat mode D(T25) Heat mode 0.385 0 spl 0 spl -0.001 spl 0 spl 0 spl 0.948 -0.004 spl -0.003 spl -0.018 spl 0 spl 0 spl 1.573 -0.006 spl 0 spl -0.015 subc 0 spl 0 spl 2.322 0 spl -0.009 subc -0.055 subc 0 subc 0 spl 2.947 -0.009 spl -0.084 subc -0.086 nucb 0 subc 0 spl 4.01 -0.002 spl -0.096 nucb 0.05 nucb - 0.0267 nucb 0.001 subc 4.823 -0.017 subc -0.024 nucb 0.037 nucb - 0.0314 nucb -0.0318 subc 5.448 -0.033 subc 0.018 nucb 0.04 nucb 0.0087 nucb -0.0381 nucb 6.135 -0.023 subc 0.032 nucb 0.017 nucb 0.0286 nucb 0.0732 nucb 6.76 -0.024 nucb 0.016 nucb -0.009 nucb 0.0055 nucb 0.0302 nucb * D (T01) = (T01C-T01X), c = calculation, x = experiment Radial void distribution and turbulent mixing and void drift discussion For radial void distribution, it is shown in Figure 3.7 that higher void fraction exist inside the centric channels and lower void fraction exist in the surrounded channels. 56 Figure 3.7 Radial void distribution of the test T04 The literal transportation of masses due to turbulent mixing and void drift are presented in the Ref. [38]. Based on output of CTF for total mass cross flow from channel to channel, it is estimated the cross mass flows in term of flow rates caused by turbulent mixing or void drift separately for the liquid phase as in Figure 3.8. Figure 3.8 Cross mass flow due to turbulent mixing and void drift for test 01 (left) and test 17 (right) It is shown that the cross transportation do not occur neither within the centric channels (channel 7 to 12) nor within surrounded channels (channel 1 to 6) but only between the surround channel and the centric channel. The literal mass transportation for void fraction is not significant in comparison with liquid transportation. The sudden change of cross flow of turbulent mixing and void drift is caused by change of heat transfer mode in one channel. Sensitivity analysis discussion As mentioned above, two sensitivity cases with maximum and minimum voiding are setup for each test. CTF boiling modeling is assessed to be appropriate with experiment if the maximum and minimum voiding curves wrap the experiment void fraction curve and its uncertainty curves with measured accuracy of ±0.03 void. The uncertainty curves are called upper or under curves if they are derived from experiment curve with adding +0.03 or -0.03 of void, respectively. In Figure 3.9 and Figure 3.10, T*exp, T*max, T*min, T*Upper and T*under are 57 corresponding to experiment, maximum voiding, minimum voiding, upper uncertainty (+0.03) and under uncertainty (-0.03) curves. It is obviously seen that for two tests T01 and T14 with pressure around 3MPa, the maximum and minimum voiding curves wrap experiment and its uncertainty curves as desired. Looking at the test T25 with pressure around 7 MPa, the sensitivity curves do not wrap the experiment curves completely. In this case, the minimum voiding curve is even over the upper uncertainty curve at the downstream of the channel where the measured void fraction above 0.5. Thus, through the right graph of Figure 3.10, it is shown clearly that CTF gives over void prediction even in case of minimum voiding. This is due to CTF boiling models with void fraction over 0.2 tend to over prediction. Figure 3.9 Maximum and minimum voiding curves versus experiment and its uncertainty curves for tests T01 and T14 Figure 3.10 Maximum and minimum voiding curves versus experiment and its uncertainty curves for tests T17 and T25 Propagation of the experiment uncertainty The experiment uncertainties on the input parameters for all tests are mentioned above. To investigate the experiment uncertainty, the calculations are performed with each base case for each test to get nominal void fraction distribution column, αnom, then each parameter will be independently changed to upper bound or lower bound of uncertainty to investigate the deviation of its void fraction distributions with its base cases distributions. 58 Table 3.9 Deviation of void fraction distributions on input uncertainties versus nominal void fraction and experiment distributions for test T01 Z T01x T01b T01P+ T01P- T01G+ T01G- T01N+ T01N- T01T+ T01T- 0.385 0 0 0 0 0 0 0 0 0 0 0.948 0 0 0 0 0 0 0 0 0 0 1.573 0 0 0 0 0 0 0 0 0 0 2.322 0 0 0 0 0 0 0 0 0 0 2.947 0 0 0 0 0 0 0 0 0 0 4.01 0 0 0 0 0 0 0 0 0 0 4.823 0.027 0.003 0.002 0.008 0.002 0.002 0.008 0.002 0.009 0.002 5.448 0.178 0.155 0.131 0.181 0.143 0.143 0.177 0.133 0.181 0.131 6.135 0.493 0.591 0.578 0.604 0.584 0.584 0.602 0.579 0.602 0.579 6.76 0.635 0.706 0.698 0.713 0.702 0.702 0.712 0.699 0.712 0.699 (x=experiment, b= base case, P±, G±, N±, T± = pressure, mass flow rate, power and temperature changed) Table 3.9 and Figure 3.11 show the deviation of void fraction distribution results from nominal void fraction distribution due to change of input parameter for test T01. Thus, it is observed that the uncertainty cases are not significant discrepancy with base case. Figure 3.11 Uncertainty void fraction distributions for test T01 Table 3.10 shows the maximum deviation compared in 10 measured locations along with the channel between nominal void fraction distribution and void fraction distributions for each change on input parameters with the tests: T01, T08, T17 and T25. It is observed that the change of pressure and temperature is more sensitive than mass flow rate and power, except case of T01. Table 3.10 Maximum deviation of void fraction distribution on input parameters versus base case for tests: T01, T08, T17 and T25 Z (m) T01 Z (m) T08 Z (m) T17 Z (m) T25 Pressure ±1.5% 5.448 αnom ± 0.026 4.823 αnom ± 0.014 6.76 αnom ±0.03 5.448 αnom ±0.028 Inlet Temp ± 1K 5.448 αnom ± 0.026 4.823 αnom ± 0.012 6.76 αnom ±0.023 5.448 αnom ±0.02 Mass flow rate ± 0.0018 kg/s 5.448 αnom ± 0.012 4.823 αnom ±0.01 6.76 αnom ±0.004 5.448 αnom ±0.005 Power ± 2kW 5.448 αnom ± 0.022 4.823 αnom ±0.01 6.76 αnom ±0.012 5.448 αnom ±0.008 59 In overall, it is concluded that the deviations between nominal void fraction distribution and its void fraction distributions due to uncertainties of measured input parameter are within measured void fraction accuracy (± 0.03). So that, CTF boiling models is stable enough with uncertainty from measured input parameters. Conclusions It is summarized some assessment of CTF boiling model for ENTEK BM tests as following: CTF gives void fraction distribution predictions with deviation from experiment distribution mainly within measured accuracy (0.03 of void) for most all base cases. Maximum deviations with 0.1 of void between CTF prediction and experiment occur at downstream of channel in some tests. CTF boiling model tends to give under predict void fraction in sub cooled region where void fraction below 0.2 and to give over predict void fraction at nucleate boiling region where void fraction above 0.2. The deviations between nominal void fraction distribution and its void fraction distributions due to uncertainties of measured input parameter are within measured void fraction accuracy (± 0.03) and CTF boiling model is rather sensitive with the change of pressure and inlet temperature than change of power and mass flow rate based on experimental measured accuracy. Turbulent mixing and void drift effects only occur between surrounded channels and centric channels, the sudden change of cross mass flow in liquid phase happens due to the change of heat transfer mode in one channel. Finally, CTF can simulate ENTEK BM tests with the appropriate results. 3.4 Verification CFX models with PSBT sub channel tests Recently, an extension of CFD code application for two-phase flow is implemented as a part of multi-scale of thermal hydraulic safety analysis. Two-phase flow CFD used for safety investigations may predict small scale flow processes, which are not seen by system thermal hydraulics codes. It is shown that at least six Nuclear Safety Reactor (NSR) problems and many other NRS issues may benefit from study at the CFD scale. More detail about CFD code application on NSR problems can be found at [10], [6]. To support numerical simulation of two-phase flow, an international project of OECD/NRC PWR sub channel and bundle tests (PSBT) benchmark is implemented based on a database provided by the Nuclear Power Engineering Corporation (NUPEC), Japan from an experimental campaign carried out at NUPEC from 1987 to 1995 and based on that time state-of-art computer tomography (CT) technology for void measurements. According to [46], the NUPEC PSBT benchmark consists of two phases with different exercises. The first phase focuses on void distribution benchmark with four exercises. The first exercise is steady-state single sub channel benchmark with different geometry (S1, S2, S3 and S4). 60 3.4.1 PSBT test section for single sub channel Figure 3.12 shows the test section used for the typical center sub channel (S1) with the heated length of 1555 mm and the measurement position of void fraction is at 1400 mm elevation from inlet located at the bottom. It is seen at cross section that the diameter of the rod is 9.5 mm and the rod pitch and rod gap is 12.6 mm and 3.1 mm, respectively. The uncertainty of measurement for input parameters as well as average void fraction at the measuring location is given in T
File đính kèm:
 luan_an_nghien_cuu_hien_tuong_chuyen_pha_trong_vung_hoat_lo.pdf
 11-Thong-Tin-LATS-EN-Mau-5-Final.pdf
 11-Thong-Tin-LATS-Viet-Mau-5-Final.pdf
 HMG-BIA-LATS-V9-EN.pdf
 HMG-BIA-LATS-V9-VN.pdf
 HMG-TOMTAT-LATS-V9-EN.pdf
 HMG-TOMTAT-LATS-V9-VN.pdf

