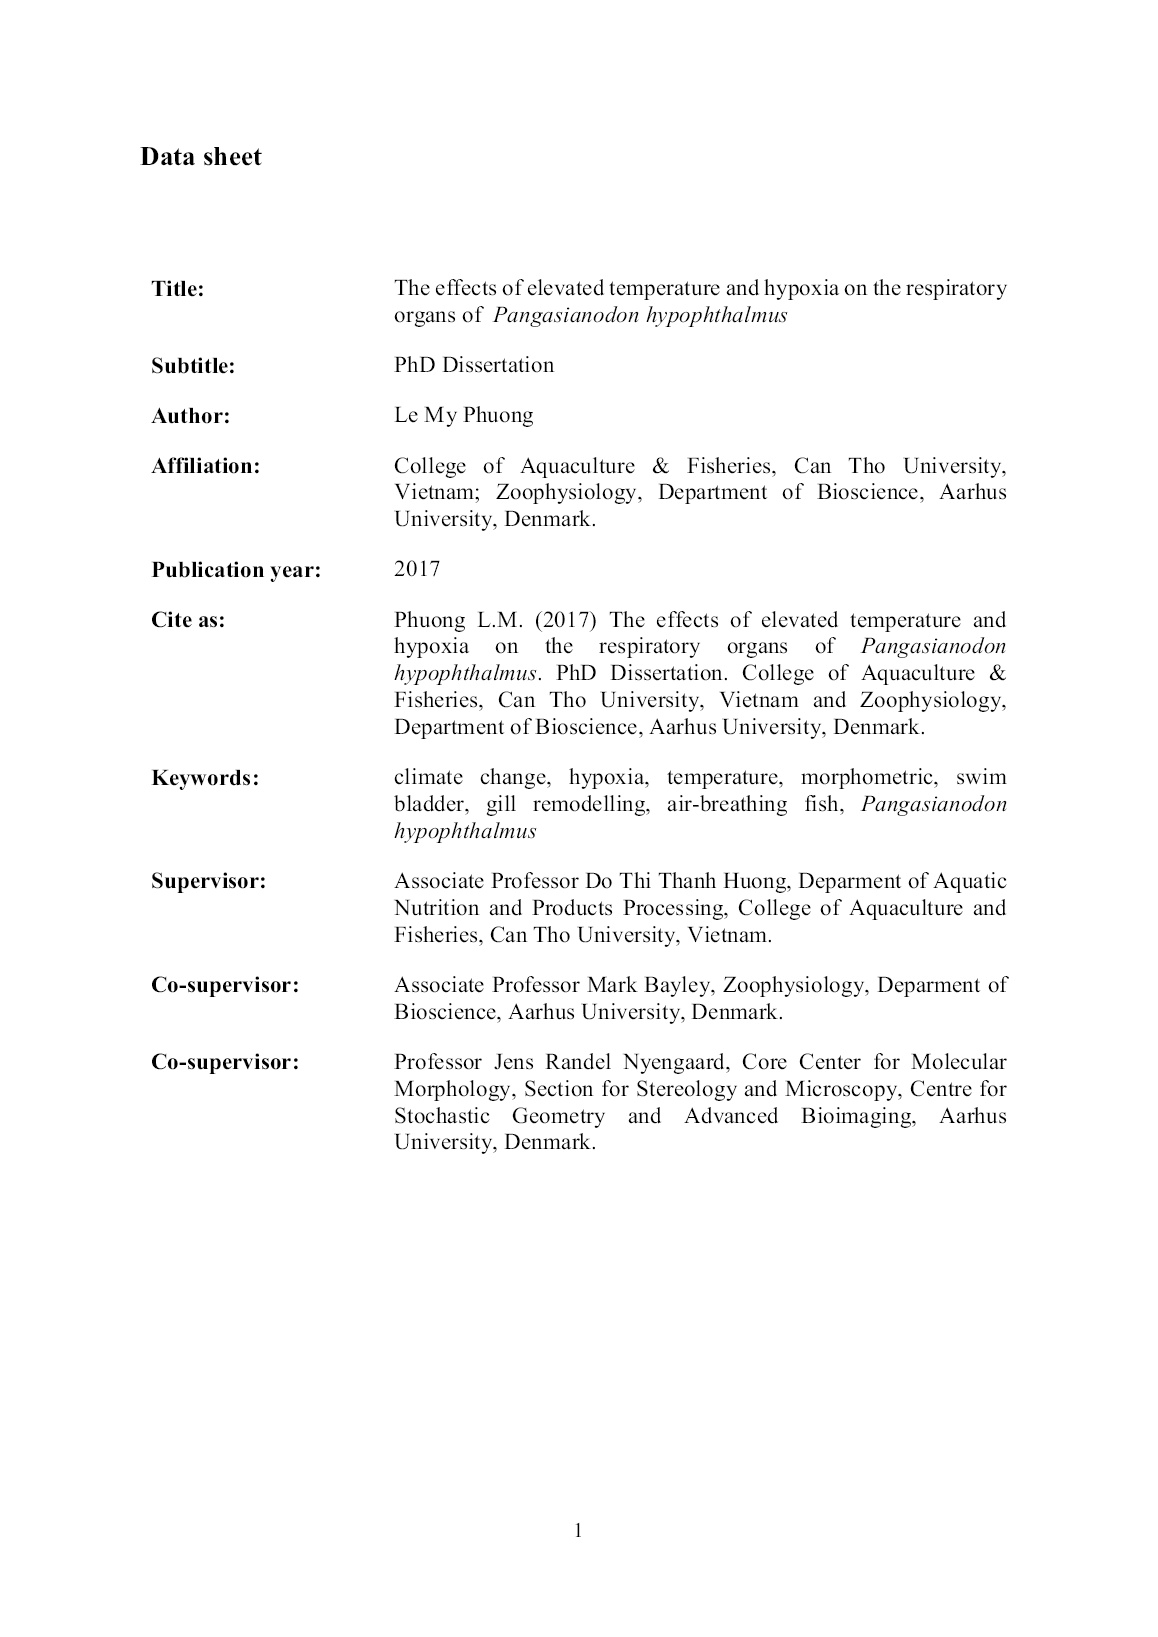
Luận án The effects of elevated temperature and hypoxia on the respiratory organs of Pangasianodon hypophthalmus
Trang 1
Trang 2
Trang 3
Trang 4
Trang 5
Trang 6
Trang 7
Trang 8
Trang 9
Trang 10
Tải về để xem bản đầy đủ
Bạn đang xem 10 trang mẫu của tài liệu "Luận án The effects of elevated temperature and hypoxia on the respiratory organs of Pangasianodon hypophthalmus", để tải tài liệu gốc về máy hãy click vào nút Download ở trên.
Tóm tắt nội dung tài liệu: Luận án The effects of elevated temperature and hypoxia on the respiratory organs of Pangasianodon hypophthalmus
𝐹
× 𝑡̅ × (
𝑎
𝑝
) × ∑ 𝑃𝑒𝑝,𝑝𝑐,𝑏𝑙
VSL (mm3) = Vep + Vpc + Vbl
Vparasites (mm3) =
1
𝑆𝑆𝐹
×
1
𝐴𝑆𝐹
× 𝑡̅ × (
𝑎
𝑝
) × ∑ 𝑃𝑝𝑎𝑟𝑎𝑠𝑖𝑡𝑒𝑠
SSF is section sampling fraction;
AFS is area sampling fraction;
t is section thickness;
∑PP are total number of points hitting primary
filaments
A/P is area per point
∑PP,ep,pc,bl are total number of points hitting
primary filaments, epithelium, pillar cells, and
blood spaces, respectively;
a/p is area per point
∑Pparasites are total number of points hitting
parasites
Surface area of secondary lamella SSL
SSL (mm2) = 2 ×
∑ 𝐼𝑖
(
𝑙
𝑝
)× ∑ 𝑃𝑖
 × 𝑉𝑆𝐿
∑Ii are total number of intersections between
test lines and secondary lamellae;
∑Pi are total number of points hitting
secondary lamellae
l/p is length per point
VSL is volume of secondary lamellae
The precision of the Cavalieri reference volume was
estimated using the coefficient of error (CE)
CE (∑P) =
√𝑇𝑜𝑡𝑎𝑙 𝑣𝑎𝑟𝑖𝑎𝑛𝑐𝑒 𝑜𝑓 ∑ 𝑃
∑ 𝑃
Total variance of ∑P = Noise + VarSURS(∑area);
Noise = 0.0724 × (b/√𝑎) × √𝑛 × ∑𝑃;
VarSURS(∑area) =
3(𝐴−𝑁𝑜𝑖𝑠𝑒)−4𝐵+𝐶
240
;
with A=Pi×Pi; B=Pi×Pi+1; C=Pi×Pi+2
Mean CE = [(CE12+CE22+...+CEn2)/n]1/2;
CV=SD/Mean
Noise is the point counting error variance;
b/√𝒂 is the average profile shape and, in this
study, the value of 12 was used for secondary
lamella shape according to the nomogram of
Gundersen and Jensen (1987);
n is the number of examined sections;
∑ 𝑷 is the total number of points hitting the
observed tissue;
VarSURS(∑area) is variance of the total
surface area.
CV is Coefficient of variance
Specific growth rate (SGR) of individual fish
SGR (%) = [(lnW2 lnW1) / t] × 100
W1 and W2 are the initial and final weight of
the fish, respectively;
t is time (days) between W2 and W1
Statistics
Data were presented as means ± standard error of the mean (means ± S.E.M). Two-way
MANCOVA (a multivariate analysis of covariance) (Ramos et al., 2012) was used in this study
to test for overall effects of temperature, oxygen or parasite volume on gill parameters followed
by Turkey’s post hoc test to identify differences between samples. For growth performance,
two-way ANOVA was used to test whether higher temperature and/or hypoxia significantly
affected on P. hypophthalmus growth performance as well as to compare means amongst
treatments in each period of samplings. A probability (P) value at the 0.05 level was considered
as significant. All the statistics applied in this study were performed by using PASW Statistic
18.0.
 56
3.3. Results
Gill morphometric
Gill surface area
There were significant changes in secondary lamellae surface area of the fish with time,
with temperature and with hypoxia (Fig. 3.1A, B; Table 3.1; Table 3.2). At the beginning of
the experiment, the respiratory surface area of small fish (12.4±0.8 g) at 27ᵒC in normoxic
water was 212±22 mm2 g-1. After 5 weeks in 27ᵒC, however, the lamella surface area decreased
significantly to 12.9±7.9 mm2 g-1. The addition of hypoxia in this group resulted in even smaller
4.9±2.3 mm2 g-1 although there was no significant difference between these two groups
(P>0.05). In both 27ᵒC groups at 5 weeks, the gill filaments had undergone a significant change
in morphology, with the inter lamellae spaces filling almost completely with a cell mass (Fig.
3.2). In contrast, fish exposed to 33ᵒC, showed surface area at 5 weeks that allometrically scaled
with size in the hypoxic group (208±29 mm2 g-1) whereas in the normoxic group a reduction to
39.4±3.5 mm2 g-1 occurred (Fig. 3.1B).
With long-term exposure (16 weeks) to the same conditions, the surface area of
lamellae in the low temperature groups was again much lower than those in elevated
temperature. Highest surface area (160±19 mm2 g-1) was found in 33ᵒC & hypoxia group,
followed by 133±25 mm2 g-1 in 33ᵒC & normoxia, which was 8.0-fold and 6.5-fold, larger than
the corresponding areas in the two groups at 27ᵒC (Table 3.1).
 57
Fig. 3.1 Respiratory lamella surface area according to body mass of juvenile striped catfish
(Pangasianodon hypophthalmus) reared in different temperatures and/or hypoxia after 5 week
exposures (I) and 1 week recovery without hypoxia exposure (II). A shows respiratory lamella surface
area of individual fish; B shows mean respiratory lamella surface area per fish body mass, with data
being presented as mean ± S.E.M. Different letters indicate significant difference amongst treatments
(P<0.05).
Fig. 3.2 Light micrographs of Pangasianodon hypophthalmus gill filaments from fish in 27ᵒC and
Normoxia treatment (left) and fish in 33ᵒC and Hypoxia treatment (right).
Scale bar 50 µm.
Fish mass (g)
0 20 40 60 80
R
e
s
p
ir
a
to
r y
 l
a
m
e
ll
a
 s
u
rf
a
c
e
 a
re
a
 (
m
m
2
)
0
2000
4000
6000
8000
10000
12000
14000
16000 27oC & 92% (Beginning)
27oC & 92% (I)
27oC & 35% (I)
33oC & 92% (I)
33oC & 35% (I)
27oC & 92% (II)
27oC & 92%* (II)
33oC & 92% (II)
33oC & 92%* (II)
Time (weeks)
0 1 2 3 4 5 6
S
u
rf
a
c
e
 a
re
a
/M
a
s
s
 (
m
m
2
 g
-1
)
0
50
100
150
200
250
a a
ac
b
b
b
b
c
A B
 58
Water – blood diffusion distance
The harmonic mean barrier thickness of juvenile P. hypophthalmus (12.4±0.8 g) was
1.67±0.12 µm (Table 3.1). It was almost impossible to measure respiratory diffusion distance
in the groups of fish after 5 and then 6 weeks of low temperature exposure under either hypoxic
or normoxic water because their lamellae were filled with ILCM (Fig. 3.2). However, in the
33ᵒC groups hypoxia caused a significant reduction in harmonic mean barrier thickness from
1.64±0.16 µm in normoxia to 1.04±0.18 µm in hypoxia (Table 3.1).
Volumes of gill components
Table 3.1 presents the volume of gill filaments and the percentages of secondary lamella
on the filaments as well as the percentages of other components (pillar cells, blood spaces, and
epithelium) constructing secondary lamella of experimental fish. The total volume of gill
filaments of juvenile striped catfish P. hypophthalmus (12.4±0.8 g) was around 101.9±5.7 mm3
(with 8.38±0.37 mm3 g-1) in which secondary lamella accounted for 12.6±1.23% (1.6±0.28%
pillar cells, 4.9±0.78% blood spaces, and 6.1±0.46% epithelium). The volume of gill filaments
ranged around 7.3 11 mm3 g-1 fish between the groups of fish exposed to temperature and/or
hypoxia. This parameter was neither significantly affected by ambient hypoxic water nor the
interaction between temperature and hypoxia factors, although being affected by temperature
(P<0.01) (Table 3.2). The volume of secondary lamellae which exposed to water of the fish at
27ᵒC groups decreased significantly after 5 weeks, to less than 1% of filament volume, and
similar in the recovery week (without exposure to hypoxia); whereas the lamella volume was
high in the high temperature group, especially with added hypoxia. At the same time, the total
blood space volume of secondary lamella in this group (9.59±1.3%) significantly increased by
a factor of 10 as compared to the other groups, and of 2 as compared to the beginning group;
however, the epithelium volume decreased twice, with 3.59±0.41% compared to 6.1±0.46% of
the beginning group. The same pattern was found for the fish exposed long-term to the
conditions (after 16 weeks), which volume of lamella decreased sharply at 27ᵒC opposite to
those of the high temperature groups (Table 3.1). During the experiments, parasites were found
on gills of several fish, however, they did not cause significant effects on any of gill parameters
observed (P>0.05) (Table 3.2).
 59
Table 3.1 Lamellae respiratory surface area (mm2 g-1), harmonic mean water-blood barrier thickness (µm), volumes of gill filaments (mm3 g-1), the
percentages of secondary lamellar volume and lamellae structural component volumes (pillar cells, blood spaces, epithelium) of Pangasianodon
hypophthalmus exposed to elevated temperature and/or hypoxia. Data are presented as mean ± SEM.
Experiments Treatments Mass (g)
Lamella
Surface
area/mass
(mm2 g-1)
Harmonic
mean
water-
blood
barrier
thickness,
τh (µm)
CV
Gill
Filament
volume/mass
(mm3 g-1)
Mean
CE
(%)
% Volume
Pillar cells
Mean
CE
(%)
% Volume
Blood spaces
Mean
CE
(%)
% Volume
Epithelium
Mean
CE
(%)
% Absolute
volume
secondary
lamellae
exposed to
water
Parasites
volume/mass
(mm3 g-1)
No. fish
infected/
Total
I
(0 week)
Beginning (n=12) 12.4 ± 0.8 212 ± 22 1.67 ± 0.12 0.26 8.4 ± 0.4 0.09 1.6 ± 0.28 0.44 4.9 ± 0.78 0.12 6.1 ± 0.46 0.07 12.6 ± 1.23 0 0/12
I
(5 weeks)
27ᵒC & 92% (n=5) 24.6 ± 2.8 12.9 ± 8.0 - - 11.3 ±1.2 0.03 0.09 ± 0.05 6.8 0.26 ± 0.16 2.1 0.62 ± 0.3 1.56 0.98 ± 0.49 0.15 ± 0.01 5/5
27ᵒC & 35% (n=5) 25.6 ± 3.6 4.9 ± 2.3 - - 10.1 ± 0.6 0.03 0.04 ± 0.02 43.2 0.16 ± 0.05 7.0 0.34 ± 0.14 5.3 0.53 ± 0.18 0.12 ± 0.02 4/5
33ᵒC & 92% (n=5) 44.3 ± 5.6 39.4 ± 3.5 1.64 ± 0.16 0.22 8.6 ± 0.5 0.03 0.43 ± 0.07 0.46 1.27 ± 0.23 0.14 1.74 ± 0.33 0.08 3.44 ± 0.6 0.1 ± 0.02 4/5
33ᵒC & 35% (n=5) 47.9 ± 1.5 208 ± 29 1.04 ± 0.18 0.08 7.5 ± 0.4 0.02 1.5 ± 0.19 0.07 9.59 ± 1.3 0.01 3.59 ± 0.41 0.02 14.67 ± 1.81 0.07 ± 0.01 4/5
I
(Recovery
1 week)
27ᵒC & 92% (n=5) 28.4 ± 2.4 4.3 ± 0.7 - - 10.1 ± 0.3 0.03 - - - - - - - 0.08 ± 0.02 3/5
27ᵒC & 35% (n=5) 25.9 ± 2.9 2.9 ± 1.2 - - 10.1 ± 0.9 0.03 - - - - - - - 0.1 ± 0.02 4/5
33ᵒC & 92% (n=5) 52.5 ± 5.7 53.5 ± 11.1 1.21 ± 0.07 0.14 8.3 ± 0.7 0.02 0.42 ± 0.1 0.46 2.47 ± 0.8 0.06 1.58 ± 0.33 0.07 4.46 ± 1.22 0.1 ± 0.02 4/5
33ᵒC & 35% (n=5) 54.1 ± 7.6 144 ± 18 0.86 ± 0.12 0.11 7.4 ± 0.4 0.02 0.82 ± 0.21 0.23 6.3 ± 0.8 0.02 2.51 ± 0.18 0.04 9.63 ± 1.12 0.05 ± 0.01 3/5
II
(16 weeks)
27ᵒC & 92% (n=5) 27.6 ± 2.8 20 ± 4 1.17 ± 0.25 0.42 7.8 ± 0.8 0.04 0.13 ± 0.04 8.3 0.58 ± 0.12 0.56 1.36 ± 0.33 0.26 2.06 ± 0.46 0.02 1/5
27ᵒC & 35% (n=4) 22.4 ± 2 19.2 ± 16.4 - - 7.3 ± 1.4 0.06 - - - - - - - 0 0/4
33ᵒC & 92% (n=5) 204 ± 36 133 ± 25 1.13 ± 0.12 0.23 7.3 ± 0.4 0.02 0.95 ± 0.27 0.54 6.01 ± 1.6 0.07 2.36 ± 0.17 0.08 9.32 ± 1.89 0 0/5
33ᵒC & 35% (n=5) 108 ± 11 160 ± 19 0.98 ± 0.07 0.14 9.4 ± 0.8 0.02 0.87 ± 0.22 0.16 4.77 ± 1.36 0.05 2.55 ± 0.91 0.06 8.19 ± 2.41 0 0/5
 60
Table 3.2 Evaluation the significant effects of temperature and/or hypoxia and parasites on growth
and gill parameters of striped catfish Pangasianodon hypophthalmus
Experiments Variables
P-value
Temperature
factor
O2
saturation
factor
Interaction of factors
(Temperature *
O2 saturation)
Parasites
 (covariate)
I
(After 5 weeks exposure)
Lamellae surface area 0.000 0.000 0.000 0.335
Filament Volume 0.004 0.127 0.937 0.566
Lamella Volume 0.000 0.000 0.000 0.357
Total Pillar cells Volume 0.000 0.002 0.001 0.445
Total Blood spaces Volume 0.000 0.000 0.000 0.590
Total epithelium volume 0.000 0.084 0.009 0.193
I
(Recovery 1 week)
Lamellae surface area 0.000 - - 0.158
Filament Volume 0.003 - - 0.266
Lamella Volume 0.000 - - 0.172
Total Pillar cells Volume 0.000 - - 0.191
Total Blood spaces Volume 0.000 - - 0.130
Total epithelium volume 0.000 - - 0.158
II
(16 weeks)
Lamellae surface area 0.000 0.540 0.427 0.640
Filament Volume 0.384 0.358 0.182 0.829
Lamella Volume 0.000 0.650 0.578 0.613
Total Pillar cells Volume 0.005 0.859 0.616 0.785
Total Blood spaces Volume 0.006 0.874 0.999
0.381
0.862
Total epithelium volume 0.260 0.829 0.333
II
(Growth experiment)
Growth performance 0.000 0.000 0.006 -
 61
Growth performance
Over the experimental period, it was found that both temperature and ambient hypoxic
water caused significant effects on striped catfish growth rate (P<0.001 and P<0.01,
respectively; Table 3.2). During the first 8 weeks of the experiment, some mortality (13-15%)
was seen in all four treatments. However, from this time onwards, no further mortality
observed. The fish in the 33ᵒC groups were clearly more active in taking feed, and the fish in
these groups grew significantly faster (P<0.05) than the 27ᵒC groups (Fig. 3.3). Thus, at 16
weeks, fish in 33ᵒC had grown from 2.4±0.1 g to 165±9.8 g and 127±6.4 g in normoxia and
hypoxia respectively; whereas in corresponding 27ᵒC groups, fish grew to only 26.5±1.7 g and
17.4±2.1 g. With respect to the 33ᵒC growth groups, the fish in normoxic water significantly
grew faster than those in hypoxic hater (P<0.05), while there was no significant effect of water
PO2 at 27ᵒC (P>0.05).
Fig. 3.3 Growth performance of juvenile striped catfish (Pangasianodon hypophthalmus) reared in
33ᵒC & normoxia (white square), 33ᵒC & hypoxia (black square), 27ᵒC & normoxia (white circle),
and 27ᵒC & hypoxia (black circle). Data are presented as mean ± S.E.M. Different letters indicate
significant difference amongst treatments at each sampling period (P<0.05).
Time (weeks)
0 2 4 6 8 10 12 14 16
F
is
h
 m
a
s
s
 (
g
)
0
20
40
60
80
100
120
140
160
180
200
a
a
b
c
a
a
b
c
a
a
b
c
a
a
b
c
a
a
b
c
 62
Specific growth rate (SGR) followed the same general patterns with the additional expected
fall in time declining from ca. 5% to around 2% in the high temperature groups, less than 2%
for the low temperature groups (Fig. 3.4). It was evident that temperature had a particularly
large effect on growth rate during the first 10 weeks with the high temperature normoxic group
attaining an astounding >4% body weight gain per day, which was twice the daily rate seen in
the two 27ᵒC groups.
Fig. 3.4 Periodic specific growth rate (SGR) of juvenile striped catfish (Pangasianodon
hypophthalmus) reared in 33ᵒC & normoxia (crossed column), 33ᵒC & hypoxia (grey column), 27ᵒC
& normoxia (open column), and 27ᵒC & hypoxia (black column). Data are presented as mean ±
S.E.M.
3.4. Discussion
Gill morphometry and gill remodelling
In the majority of fish species, the gills represent the primary organ for fish respiration
but are also central in ionic and osmotic regulation, acid-base regulation, and in nitrogenous
excretion (Evans et al., 2005; Diaz et al., 2009). The basic structures of the gills of P.
hypophthalmus gills follow the generalised pattern in teleosts (Wilson and Laurent, 2002;
Evans et al., 2005; Fernandes et al., 2012). The overall appearance is of large gill arches with
Time period (weeks)
0-8 10 12 14 16
S
G
R
 (
%
)
0
1
2
3
4
5
33C & Normoxia
33C & Hypoxia
27C & Normoxia
27C & Hypoxia
 63
long primary filaments resembling that of an active water breather such as rainbow trout.
Although the present experiment was not designed to detect mitochondrial rich cells, visual
inspection revealed that these ionophores are present on the primary lamellae in P.
hypophthalmus and where present, within the ICLM, but are absent from secondary lamellae.
In line with previous suggestions that this species has a large branchial surface area
(Lefevre et al., 2011a, b; Lefevre et al., 2013; Damsgaard et al., 2015a) we measured a large
branchial surface area in small individuals (12.4±0.8g) (27ᵒC and normoxia) and in fish grown
for 5 weeks to 47.9±1.5g at 33ᵒC in hypoxia (35% saturation) to be 212±22 mm2 g-1 and 208±29
mm2 g-1, respectively (Table 3.1, Fig. 3.1). These values are indeed high compared to those of
other air-breathing fish species and compare well to active water breathing species (Fig. 3.5
and refs therein). However, the second part of our hypothesis that predicted a reduction in gill
SA in hypoxia to reduce the risk of oxygen loss was not supported. Thus in experiment 1,
groups grown at 27ᵒC grew to a size of 20-30g over the five weeks, and developed ICLM in
both normoxic and hypoxic treatments with secondary lamellae SA of 4-13 mm2g-1, with no
significant effect of oxygen saturation. Those grown in 33ᵒC on the other hand grew much
faster to 44-48g and also attained larger gills reaching 39 mm2g-1 in normoxia but 208 mm2g-1
in hypoxia (Table 3.1, Fig 3.1). The difference in these two groups being in the degree of
ICLM proliferation (e.g. Fig 3.2). In the second experiment, which ran for 16 weeks instead of
6 the same growth stimulation was seen in relation to temperature and also the same trend for
a strong temperature effect on SA. There was also a trend for higher SA in the 33ᵒC in hypoxia
compared to in normoxia, but here the differences were not significant. Thus we conclude that
secondary lamellae SA in P. hypophthalmus respond to increased oxygen demand by
increasing SA, resulting in the highest SA in hypoxia at the highest temperature, and do not
find support for reductions in SA in hypoxia. In this respect the SA plasticity we see in P.
hypophthalmus resembles that of the crucian carp (Sollid et al., 2003, 2005; Sollid and Nilsson,
2006) as well as a variety of other water breathing fish (Matey et al., 2008; Tzaneva and Perry,
2010; Tzaneva et al., 2011; McBryan et al., 2016). It should be noted that when the ICLM is
fully developed in this P. hypophthalmus, the apparent respiratory SA is then small even for
obligate air-breathing fishes (Fig. 3.5). Nilsson (2007) argued that fish gill remodelling could
be an ancient mechanism, which could be present in many other teleost species but which
remains largely unexplored. It has since been shown that environmental changes can also
induce gill morphology modifications in air-breathing fish. Thus the mangrove killifish
remodels its gills as a result of air-exposure (Ong et al., 2007) and the dwarf gourami remodels
 64
its gills as a result of water acidification (Huang and Lin, 2011). In addition to these SA
differences, the harmonic mean water – blood diffusion barrier of P. hypophthalmus (1.67±0.12
µm) was thin compared to these water-breathers but was similar to the facultative air-breather
Boleophthalmus boddarti (1.43 µm; Niva et al., 1981) (Fig. 3.5).
Branchial surface area (mm
2
 g
-1
)
0 200 400 600 800 1000 1200 1400
W
a
te
r-
b
lo
o
d
 d
if
fu
si
o
n
 d
is
ta
n
c
e
 (
m
)
0
2
4
6
8
10
12
Dogfish
Brown Bullhead
Climbing perch
Arapaima
Arapaima
Icefish Rainbow trout
Stinging catfish
Tench
Wolf fish
SnakeheadWalking catfish
Striped catfish
Mud Skipper
Horse Mackerel
Striped catfish
Striped catfish
Striped catfish
Striped catfish
Tuna
Fig. 3.5 Respiratory gill surface area and harmonic mean barrier thickness of several fish species with
different life-styles and habitats. Icefish, Chaenocephalus aceratus (Hughes, 1972); Rainbow trout,
Oncorhynchus mykiss (Hughes, 1972); Tench, Tinca tinca (Hughes, 1972); Brown bullhead, Ameiurus
nebulosus (Hughes, 1972); Dogfish, Scyliorhinus canicula (Hughes, 1972); Wolf fish, Hoplias
malabaricus (Fernandez et al., 1994; Sakuragui et al., 2003); Climbing perch, Anabas testudineus
(Hughes et al., 1973); Arapaima, Arapaima gigas (da Costa et al., 2007; Fernandez et al., 2012);
Snakehead, Channa punctatus (Hakim et al., 1978); Walking catfish, Clarias mossambicus (Maina
and Maloiy, 1986); Mud Skipper, Boleophthalmus boddarti (Niva et al., 1981); Stinging catfish,
Heteropneustes fossilis (Hughes and Munshi, 1973); Horse mackerel, Trachurus trachurus (Hughes,
1966); Tuna, Katsuwonus pelamis (Muir and Hughes, 1969); Striped catfish, Pangasianodon
hypophthalmus (Present study). Water-breathing species: opened circles; Facultative air-breathing
species: semi-filled left circles; Obligate air-breathing species: black circles. Note: Five groups of
striped catfish with the gills embedded by ILCM were not presented because of the lack of diffusion
distan
File đính kèm:
 luan_an_the_effects_of_elevated_temperature_and_hypoxia_on_t.pdf
 Tóm tắt lận án - Tiếng Việt - Lê Mỹ Phương.pdf
 Tóm tắt luận án-Tiếng Anh - Lê Mỹ Phương.pdf
 Trang thông tin về luận án - Lê Mỹ Phương.docx
 Trang thông tin về luận án - Tiếng Anh - Lê Mỹ Phương.docx

