Tóm tắt Luận án Nghiên cứu một số đặc điểm sinh học, sinh sản của loài ong Apis Cerana nuôi tại Thái Nguyên
Trang 1
Trang 2
Trang 3
Trang 4
Trang 5
Trang 6
Trang 7
Trang 8
Trang 9
Trang 10
Tải về để xem bản đầy đủ
Bạn đang xem 10 trang mẫu của tài liệu "Tóm tắt Luận án Nghiên cứu một số đặc điểm sinh học, sinh sản của loài ong Apis Cerana nuôi tại Thái Nguyên", để tải tài liệu gốc về máy hãy click vào nút Download ở trên.
Tóm tắt nội dung tài liệu: Tóm tắt Luận án Nghiên cứu một số đặc điểm sinh học, sinh sản của loài ong Apis Cerana nuôi tại Thái Nguyên
e time conducted on 16 queens in different age
groups (≤ 6 months old: 5 queens, 7 - 12 months old: 5 queens, at the
age of13-18 : 3 queens and > 18 months old: 3 queens). Sampling,
sample preservation of thequeens were similar to the indicators
mentioned above.
* Content 3:Some biological and reproductive characteristicss
of queen bees
- Rate of natural colony division with place and season: Direct
monitoring was conducted in 140 colonies in two places in Thai
nguyen city, Dong Hy district in Spring - Summer and Winter -
Spring, in each place70 colonieswere used.
8
 - Number of queen cells built according to season and colony
size: 140 colonies that had 3-6 honycombs in 2 seasons Spring -
Summer and Autumn - Winter were monitored.
- Time of practising oriented flight and mating flight of queens:
20 queens were monitored for 2 years on the sunny days in spring -
summer. A self-observing instrument with holes drilled having size
of 7mm in diameter was used. The direct observation instrument was
put at the door of beehive that had queens having emerged for 2-3
days. When the queens were seen in the observed box, the box was
picked up and the queens were released to fly away and the box was
put in the original location. The time of releasing queens was
recorded and monitoring was continued until the queens flied back,
When flying back to the hive they crawled around the box to find
ways to get into the box.
- Number of tímes a queen bee mates with drones: These queen
were continued monitoring in the following 3 days, method of
monitoring was the same as the one presented in the indicator “Time of
orientation flight and mating flight of queen bees”.
- Number of eggs laid by the queen: 25 queens from 3 different
origins were selected(queens from natural colony division, artificially
raised queens and supercedure queens). These queens were born in
two different seasons (Spring - Summer and Autumn - Winter),For
each source and season, 05 queens were monitored. Steel frames
were placed in squares with area of 4.5 cm x 4.5 cm (corresponding
to 100 cells per comb). Two surfaces of comb and all honeycombs in
the colony were measured. Number of Caped combs in each square
was estimated to. count number of pupal cells. Total number of
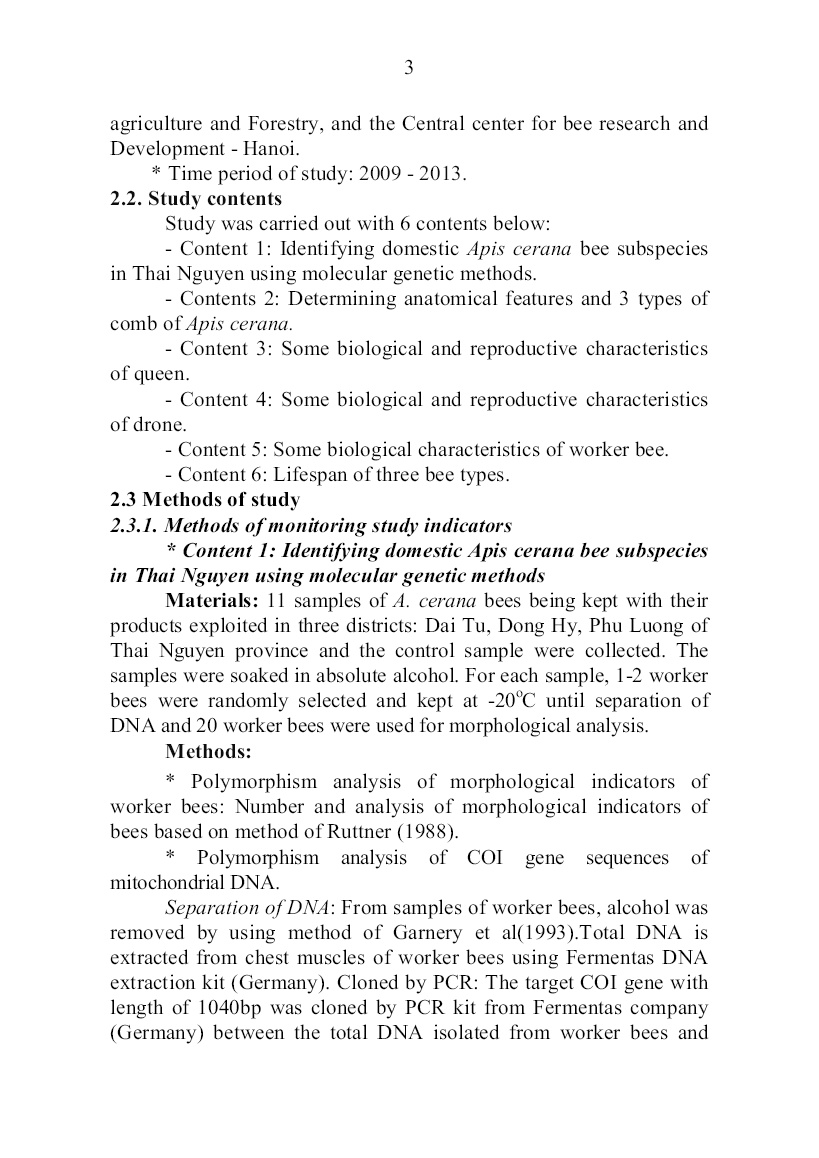
capped pupae/day and night was calculated using the formula:
Number of pupae
(pupae/day/night)
=
Number of pupa square x 100
11
(Where: The number 11 is the number of days of pre-pupae and
pupae night in the capped comb; 100: the number of pupa combs in
the pupal area with size of 4.5× 4.5 cm)
- The relationship between the age of the queen with number of
eggs laid: 16 queens in different age groups were moniored the first
time (≤ queens, from 13-18 months old 3 queens and > 18 months
old: 3 queens). Counting number of eggs laid by the queen was
similar to the way as having been shown in the indicator "Number of
the queen's eggs".
9
* Content 4: Some biological and reproductive characteristics
of drones
+ Number of drones in different seasons: 60 bee colonies were
directly monitored in 4 seasons: Spring - Summer; Summer -
Autumn; Autumn - Winter and Winter - Spring. Calculating number
of drones by direct examinating number of drones presenting in each
colony.
+ Number of spermatozoa produced by drones: 20 bee colonies
weremonitored in the mating season and other seasons rather than the
mating season of Apis cerana. Method of testing: 25 drones of each
colony were caught and each drone was confined in a vial without
food within a few hours to weaken the drone. Small needles of a
surgical instrument for insect were used to separate reproductive
organs of drones, seminal vesicle of drone was orange. Then, each
seminal vesicle was soaked in 1 ml of 0.9% NaCl solution, a clamp
was used to break the seminal vesicle and 1 ml of distilled water was
added to disperse sperm in the solution, a microscope was used to
count spermatozoa of drones in a newbauer chamber. This was
conducted in the Life Science Institute of Thai nguyen university of
Agriculture and Forestry.
+ The relationship between weight of drones and number of
spermatozoa of drones: 25 drones with different weight were
monitored at the same time (≤ 120 mg, 121-123 mg; 124 - 126mg;
127-129 mg and> 129 mg), 05 drones were used for each group. The
way of performing was the same as the one shown in the indicator
"Number of spermatozoa of drones " that. Was conducted in the Life
Science Institute of Thai Nguyen university of agriculture and forestry.
* Content 5: Some biological and reproductive,
characteristics of worker bees:
+ Size of ovary and number of oviducts of worker bees:
Monitoring was carried out in 10 worker bees. The way of oviduct
storing was the same as in the queen samples. The experiment was
caried out in the central centre of bee research and Development.
+ Time of eggs laid by worker bees after separating queen: 20
bee colonies in 4 different seasons were monitored, each season 5
colonies were used. time of worker bee laying were calculated from
time of separating queen from bee colony to the time.
of presenting eggs in the combs.
10
* Contents 6: Lifespan of three types of bees
3 types of honey bees were marked with acetone emulsifier, for
each colony, a different colour was used. The lifespan of three types
of bees were calculated since time of their emerging until time they
were not present in the colony.
2.3.2. Methods of data processing:
The data was processed by study methods in animal science
byNguyen Van Thien et al (2002) and Minitab version 14 software,
including statistical parameters: mean values; Deviation of the average;
Coefficient of variation: CV (%); Comparison of the average difference;
The regression equation and corelation coefficient.
Chapter 3. RESULTS AND DISCUSSION
3.1. Identifying Apis cerana subspecies of domestic bees in
Thai Nguyen using methods of molecular genetic, Apis cerana bee
subspecies that was being kept and exploited in Taiyuan of Apis
cerana indica in Thai Nguyen was of Apis cerana indica subspecies,
this subspecies has lower yield than Apis cerana cerana subspecies.
3.2. Anatomical features and comb of Apis cerana
3.2.1. Weight size of bee comb of 3 bee typesThe weight and size of
bee comb of the bee types is given in Table 3.1a
Table 3.1a. Volume, size of 3 kinds of bee hive
Indicator n
Volume (ml)
Size (mm)
Lenght Width
xmx
Cv
(%) x
mx Cv
(%) x
mx Cv
(%)
1. Qeen cell cell
- Thai Nguyen city 15 0,50a 0,18 12,38 16,60a 0,11 12,20 7,14a 0,04 12,64
- Dong Hy district 15 0,68b 0,26 11,04 17,32b 0,14 11,42 7,48b 0,06 11,86
Average 0,56 16,96 7,31
2. Drone Comb colony
-Thai Nguyen city 5 0,28a 0,02 12,74 11,64a 0,14 11,26 5,27a 0,18 11,12
- Dong Hy district 5 0,34b 0,04 11,42 12,45b 0,21 11,72 5,42b 0,24 11,56
Average 0,31 12,05 5,35
3. Worker bee Comb colony
- Thai Nguyen city 5 0,21a 0,01 10,34 9,60a 0,12 10,20 4,53a 0,08 9,89
- Dong Hy district 5 0,24b 0,02 10,51 11,00b 0,17 11,54 4,67b 0,10 10,78
Average 0,22 10,03 4,60
* In the same column,with the same indicator group the numbers carrying
different letters were different in statistical signifficance with P<0,05
11
The data in table 3.1a reveals that The volume and size of queen
cells of Apis cerana bee reared in Thai Nguyen had the following
dimensions: 16.60 - 17.32 mm in length; 7.14 - 7.48 mm in width. The
average volume was 0.56 ml (varied from 0.50 to 0.68 ml). The
volume and size of drone comb was from 11.64 to 12.45 mm in length
and 5.27 - 5.42 mm in width The volume ranged from 0.28 to 0.34 ml
(theaverage was 0.31 ml). The volume and size of worker comb was
9.60- 11.00 mm in length and 4.53 - 4.67 mm in width. The volume
ranged from 0.21 to 0.24 ml (the average was 0.22 ml).
3.2.2. Weight of 3 bee types
Weight of 3 bee types was given in table 3.2.
Table 3.2. Weight of 3 bee types
Indicator
Newly hatched bees Adults
xmx
(mg)
Cv
(%)
Comparat
on (%)
xmx
(mg)
Cv
(%)
Comparat
on (%)
1. Queen bees, n = 30
1. Naturally raised
queen n=5
158,04a 1,42 10,12 181,05 202,15a 1,53 11,25 293,40
2. Artificial raised
queen n=5
157,30a 1,51 11,04 180,20 201,67a 1,84 10,54 292,70
3. Supersedure queen
n=5
151,34b 1,14 10,76 173,38 198,78b 1,65 11,06 288,50
Average 155,56 178,21 200,87
2. Drones, n = 10 102,18 1,82 12,07 117,06 114,02 1,62 11,73 165,49
3. Worker bees, n = 10 87,29 3,42 11,83 100 68,90 3,03 11,42 100
* In the same column,with the same indicator group the numbersr carrying
different letters were different in statistical signifficance with P<0,05
The result in table 3.2 shows that weight of the queen bee of
young Apis cerana reared in Thai Nguyen ranged from 151.34 mg -
158.04 mg, average weight was 155.56 mg. Weight of adult queen
(laying queen) of Apis cerana bees reared in Thai Nguyen ranged from
198.78 mg - 202.15 mg, average weight was 200.78 mg, 44 mg, 31 mg
(29.13 %.) higher than the young queen. Comparing the weight of 3
types of queen bees from different sources, we found that the weight of
naturally raised queen and artificially raised queen nearly equal at
hatching and adult (P> 0.05). As for the supersedure from hatching to
adult, the weight was 2.89 to 6.70 mg smaller than naturally raised
queens and artificially raised queens, equivalent to 1.43 to 4.24 %.
3.2.3. Relationship between origin, season with number of queen’s
oviducts
The results were given in table 3.3.
12
Table 3.3. Relationship between origin, season with number of
queen’s oviducts
Origin
n
Number of oviducts Comparison
Autumn -
Winter/ Spring
- summer (%)
Spring - summer Autumn - Winter
xmx
(ống)
So sánh
(%)
xmx
(ống)
So sánh
(%)
1. Naturally raised
queen
10 95,11a 3,21 100 93,06a 2,66 100 97,68
2. Artificial raised
queen
10 93,82b 2,44 98,86 91,64b 2,20 98,47 97,84
3. Supersedure
queen
10 89,16c 2,76 93,74 87,27c 2,52 93,79 97,88
Average 92,70 90,67 97,81
* In the same column,with the same indicator group the numbersr carrying
different letters were different in statistical signifficance with P<0,05
The results in table 3.3 shows that the origins of the queen and
season were factors that directly affected number of the queen's
oviduct. In the Spring - Summer, supersedure queen had the lowest
number of oviducts (89.16), followed by artificially raised queen
(93.82) and naturally raised queen had the highest (95.11). Similarly,
in Autumn - Winter, supersedure queen had the lowest number of
oviducts (87.27), followed by artificially raised queen (91.64) and the
naturally raised queen had the highest (93.06). The queens that had
the same origin but were born in different seasons, number of
oviducts was significantly different. Specifically, the naturally raised
queen in spring - summer had 2.05 more oviducts than those in
Autumn - Winter (2.20%). Similarly artificial raised queen had 2.18
oviducts higher than those in Autumn - Winter and supersedure
queen had number of oviducts 1.89 higher in spring - summer than
those in Autumn - Winter, *2,39% and 2.16% respectively).
3.2.4. Relationship between weight of laying queen with number of
oviducts
The results are given in table 3.4.
Table 3.4. Relationship between weight of laying queen with
number of oviducts
Index Weight of queen (mg) n Number of oviducts;
xmx
1 < 190 5 93,62a 0,65
2 191 - 195 5 95,23b 2,46
3 196 - 200 5 97,46b 3,21
4 201 - 205 5 99,18c 2,17
5 > 205 5 102,54c 2,74
Coeficiencen (r) 0,73
* In the same column,with the same indicator group the numbers carrying
different letters were different in statistical signifficance with P<0,05
13
The results in table 3.4 show that number of oviducts of queen
was in direct ratio to its body weight, the higher the body weight, the
higher the number of oviducts (P <0.05). Specifically, the queen that
weighed <190 mg, number of oviducts was 93.62; group of queens
weighed from 191-195 mg, number of oviducts was 95.23; queen
weighed from 196-200 mg, number of oviducts was 97.46; queen
weighed from 201-205 mg, number of oviducts was 99.18 and queen
weighed > 205 mg number of oviducts was 102.54.
3.2.5. Volume and size of spermatheca
The results are given in table 3.5.
Table 3.5. Volume and size of spermatheca
Origin, season n
Volume
(µl)
Cv
(%)
Size of spermatheca (mm)
Lenght
xmx
Cv
(%)
Width
xmx
Cv
(%)
Origin
1. Naturally
raised queen
5 35,04a 0,66
11,43
0,067a 0,003
13,02
0,041a 0,002
12,91
2. Artificial
raised queen
5 34,89a 0,74
12,04
0,065a 0,002
12,64
0,040a 0,003
12,40
3. Supersedure
queen
5 31,76b 0,12
11,28
0,052b 0,003
12,76
0,036b 0,004
12,22
Average 15 33,56 0,061 0,039
season
1. Spring -
summer
5 34,96a 0,35 10,65 0,066a 0,002 12,68 0,040a 0,003 11,87
2. Autumn -
Winter
5 33,14b 0,41
11,47
0,050b 0,003
12,70
0,034b 0,003
12,56
Average 10 34,05 0,058 0,037
* In the same column,with the same indicator group the numbers carrying
different letters were different in statistical signifficance with P<0,05
The data in table 3.5 reveal that length of spermatheca of Apis
cerana queen ranged from 0.055 to 0.067 mm, its width was 0.034 to
0.041 µl, and its volume was from 31.76 to 35.04l, average was
33.56 to 34.05.
Seasonally, the study results show that spermatheca of the queen
that was born in Spring - Summer was larger than that of the queen
born in Autumn - Winter (34.96 versus 33.14 µl). There was also
significant difference in body size between two seasons and this was
statistically significant with P < 0.05.
3.2.6.Number of spermatozoa stored in spermatheca
The results are given in table 3.6.
14
Table 3.6. Relationship between origin of queen and season with
number of spermatozoa in spermatheca
Index Origin, season n
Number of spermatozoa in
spermatheca of queen <12
spermatozoa (million)
xmx Cv (%)
I
Origin
1. Naturally raised queen 5 3,52a 0,20 11,81
2. Artificial raised queen 5 3,20b 0,12 12,03
3. Supersedure queen 5 2,86c 0,34 11,78
Average 3,19
II
Season
1. spring - summer 5 3,45a 0,16 12,05
2. Autumn - Winter 5 2,96b 0,38 11,86
Average 3,21
* In the same column,with the same indicator group the numbers carrying
different letters were different in statistical signifficance with P<0,05
The data in table 3.6 indicate that: For the queen in good
reproductive period (at the age of < 12 months), number of
spermatozoa stored in spermatheca ranged from 3.19 to 3.21 million.
This number was dependent on origin and season when
the queen was born, regarding the origins of the queen: stored sperm
in naturally raised queen was the highest (3.52 million), followed by
artificially raised queen (3.20 million) and the lowest was that of
emergency queen: 286 million spermatozoa (with statistical.
 significance (P < 0.05). With regard to seasons: The queen that was
born in Spring - Summer had higher number of spermatozoa than that
of the queen born in Autumn - Winter (3.45 versus 2.96), and this
difference was significant with P < 0.05).
3.2.7. Relationship between weight of queen and number of spermatozoa
in spermatheca
The study results of this issue are given in table 3.7.
Table 3.7. Relationship between weight of queen and number of
spermatozoa in spermatheca
Index
Weight of queen
(mg)
n
Number of spermatozoa in
spermatheca (million);
xmx
Comparison
(%)
1 ≤ 190 5 2,85a 0,10 100,00
2 191 - 195 5 3,10b 0,05 108,78
3 196 - 200 5 3,32c 0,12 116,49
4 201 - 205 5 3,41d 0,20 119,65
5 > 205 5 3,50e 0,34 122,80
Correlation coeficient (r) 0,58
* In the same column,with the same indicator group the numbers carrying
different letters were different in statistical signifficance with P<0,05
15
following-up of 25 naturally raised queens at the age of under 12
months that were divided into 5 groups according to the criterial
weight, the group with smallest weight (≤ 190mg/ queen) and the
group with the largest weight (> 205mg /queen). As a result, number
of spermatozoa in the spermatheca of queen varied from 2.85 to 3.50
million and was positively correlated with the weight of the queen.
Specifically, in the group with the weight ≤190mg number of
spermatozoa was only 2.85 million, increasing to 3.32 million in the
group with the weight from 196 to200 mg/ queen and the highest was
in the group with body weight > 205mg/ queen (3.50 million
spermatozoa). Thus,there are significant differences in number of
spermatozoa stored in spermatheca of queen among various groups
with different weight (P <0.05).
3.2.8. Relationship between age of queen and number of spermatozoa in
spermatheca of queen
Results of monitoring 12 queens at the different age are given in
table 3.8.
Table 3.8. Relationship between age of queen and number of
spermatozoa in spermatheca of queen
Index Queen age (tmonth) n
Number of spermatozoa in
spermatheca (million);
xmx
1 ≤ 6 5 3,52a 0,16
2 7 tt - 12 5 3,15b 0,12
3 13 - 18 3 2,46c 0,07
4 > 18 3 1,24d 0,03
* In the same column,with the same indicator group the numbers carrying
different letters were different in statistical signifficance with P<0,05
From table 3.8 we found that like the relationship between the
weight of queen with number of spermatozoa stored, the age of queen
was closely related to the number of spermatozoa stored. In the group
of queens aged ≤ 6 months number of spermatozoa stored, reached
3.52 million, reducing to 3.15 million at the age of 7-12 months and
only 1.24 million spermatozoa when the queen was at the age of
more than 18 months. The difference in number of spermatozoa
stored between 4 age groups was significant with stasstical sigificant
level (P < 0.05). In our opinion, this is an important evidence
supporting viewpoint of queen's associated with colony’s potential,
The bee colony potential was also expressed by number of crowded
healthy worker bees. The queen at the appropriate age not only laid
well but also laid the fertilized eggs, producing worker bees. In
contrast unfertilized eggs will produce drones.
16
3.3. Several biological and reproductive characteristics of queen bee
3.3.1. separation rate of colony with season
The results are given in table 3.9.
Table 3.9. Rate of colony separation with season and place
Place, season
Number of colonies
monitored (colony)
Number of colonies
separated (colony)
Rate
(%)
1. Place
- Thai Nguyen city 70 63 90,00
- Dong Hy 70 64 91,42
2. season
- Spring - Summer 70 64 91,42
- autumn- winter 70 22 32,42
From table 3.9 we found that there was no significant difference
between the rate of division in the 2 places,varying from 90.00 to
91.42%. Comparing two seasons showed that in Spring - Summer
division rate reached over 91.42 while in Autumn - Winter was only
32.42%. The reason for the difference between the two seasons was
that during Spring - Summer, the weather is favourable, rich flowers,
bees accumulated a lot of food, queens laid a lot of eggs, bees were in
large number, the potential of colon’s development was the highest,
therefore in this season division rate of bee colony reached 90.67%.
In contrast in Autumn - Winter, the conditions needed for the
development of bees were not as favorable as in Spring - Summer,
only the strongest potential colony (in large number, a lot of honey
combs) could divide.
3.3.
File đính kèm:
 tom_tat_luan_an_nghien_cuu_mot_so_dac_diem_sinh_hoc_sinh_san.pdf

