Luận án Risk management in software project scheduling using bayesian networks
Trang 1
Trang 2

Trang 3

Trang 4
Trang 5
Trang 6
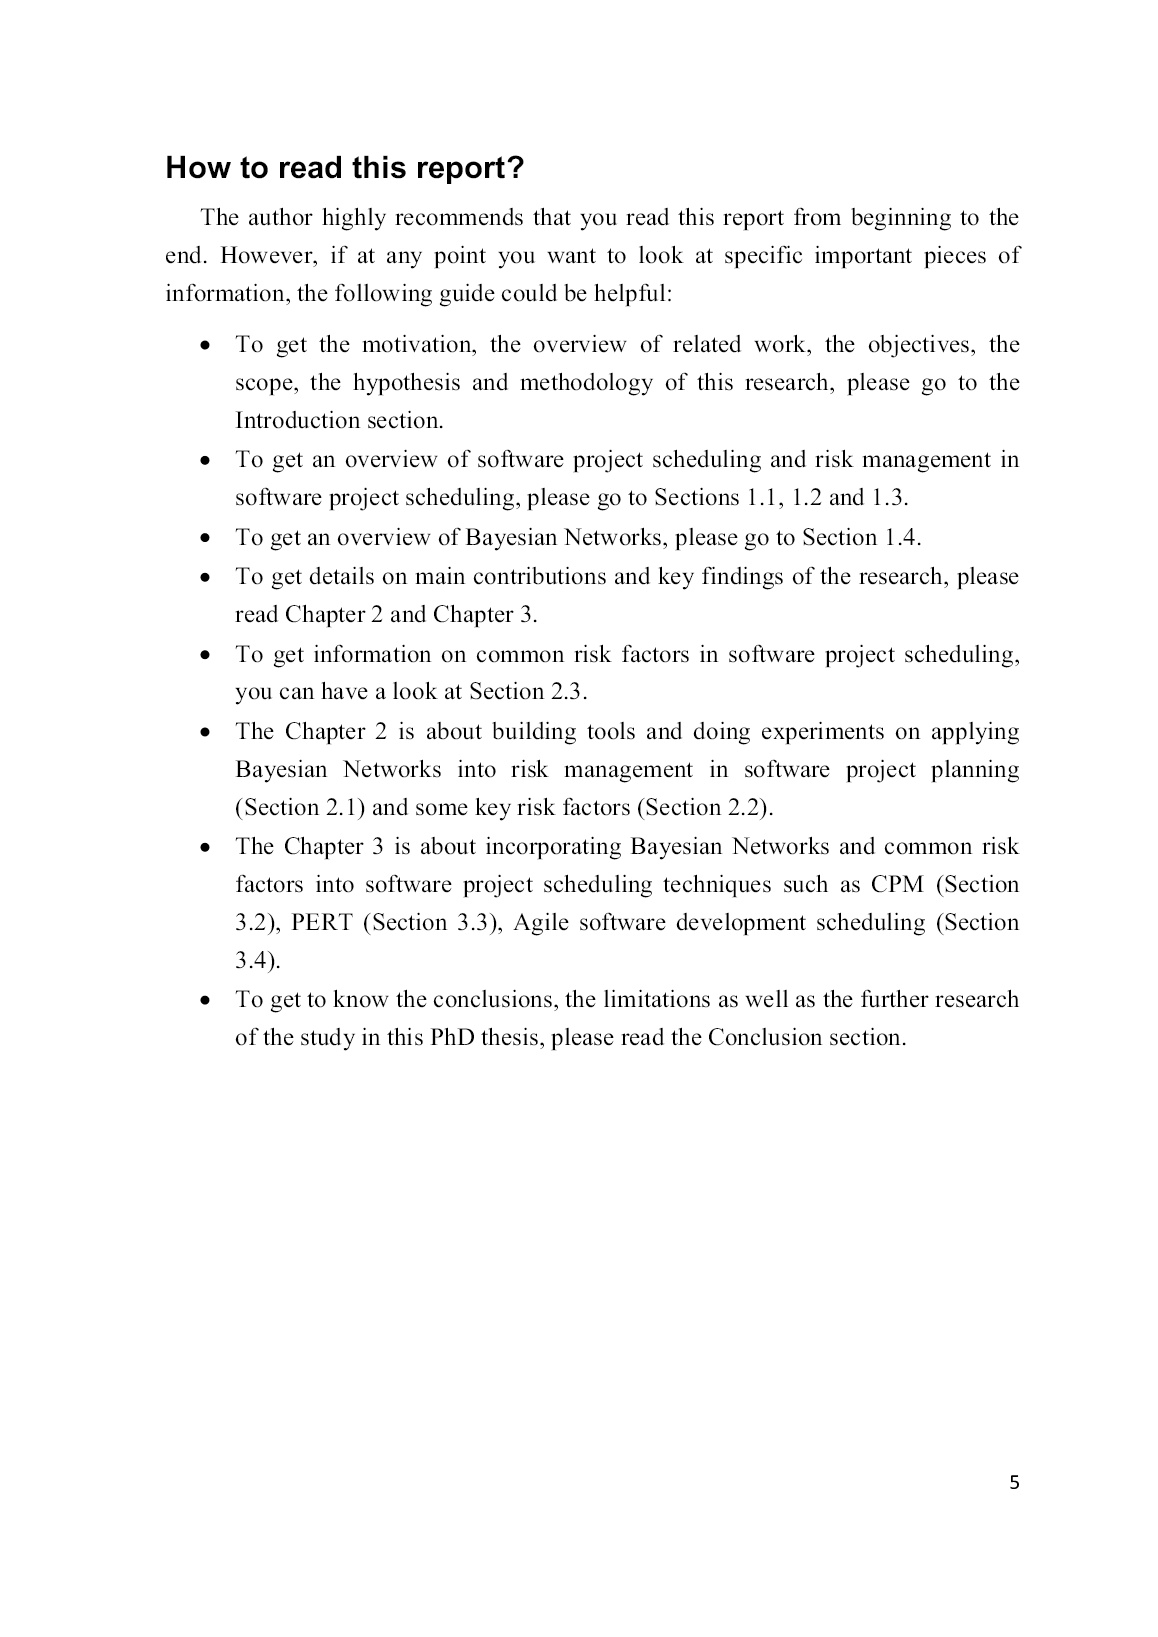
Trang 7
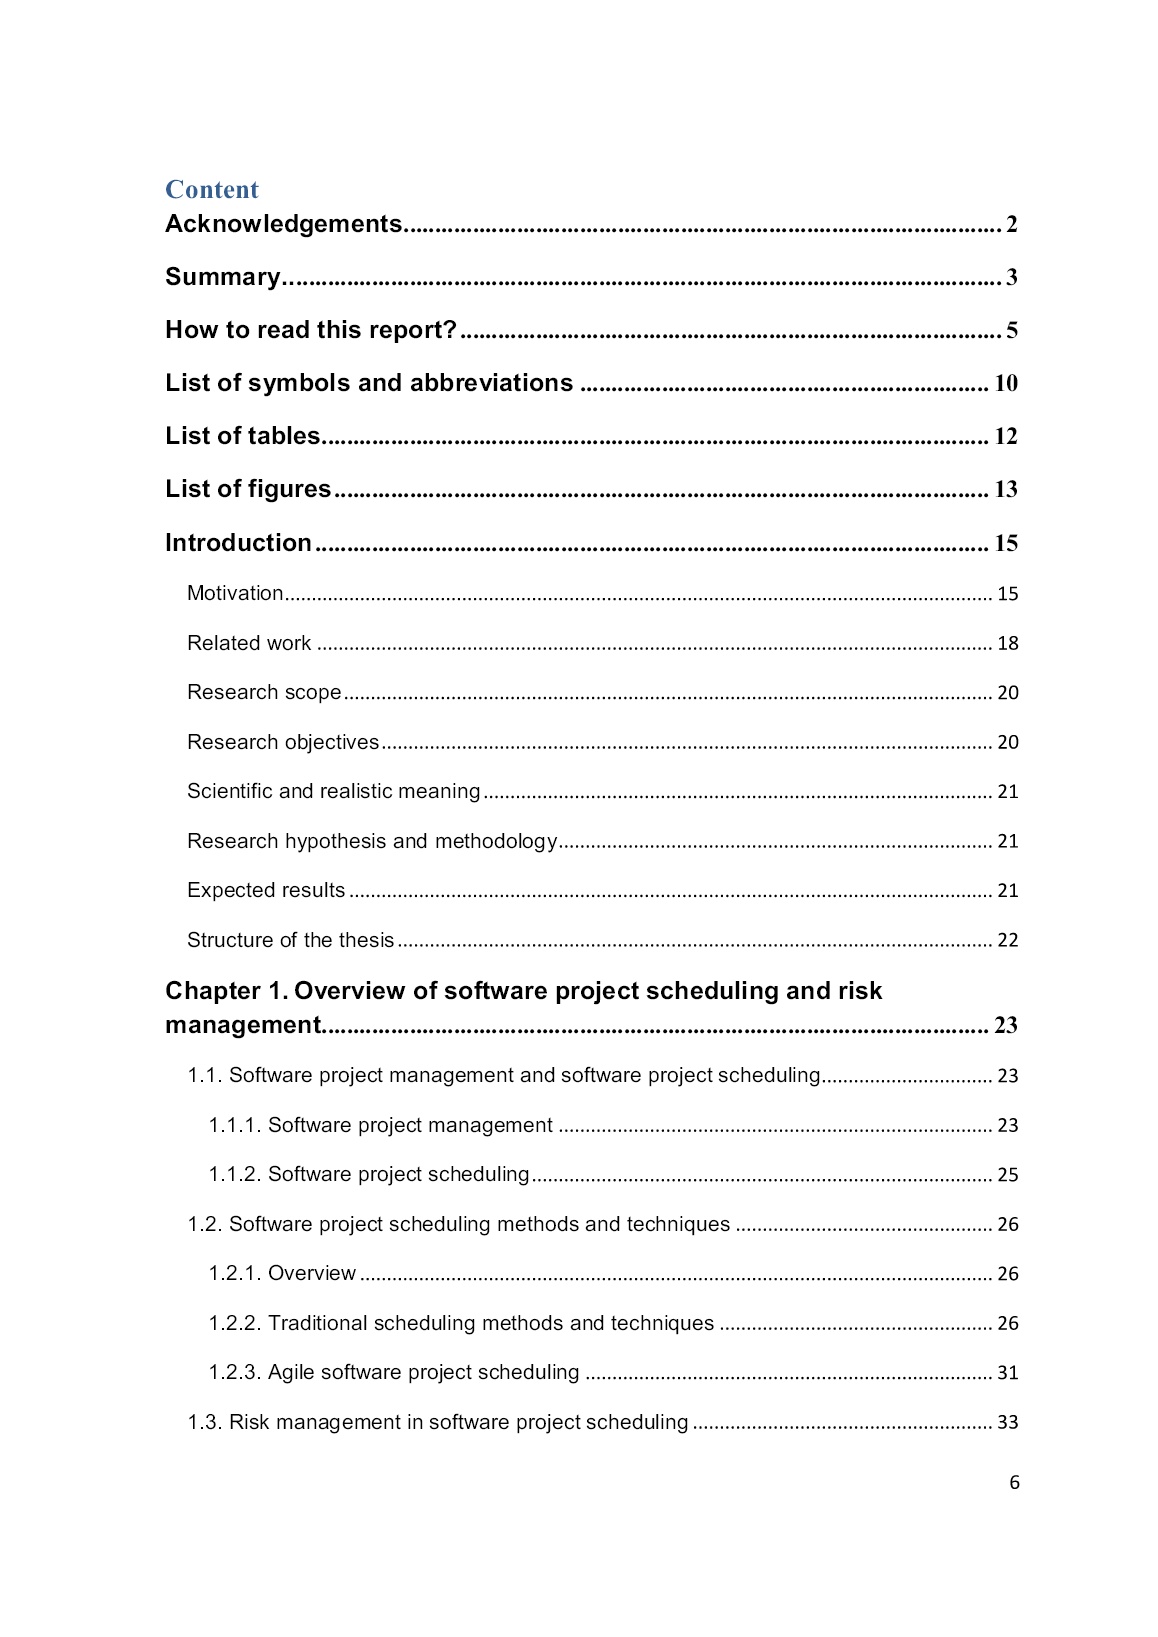
Trang 8
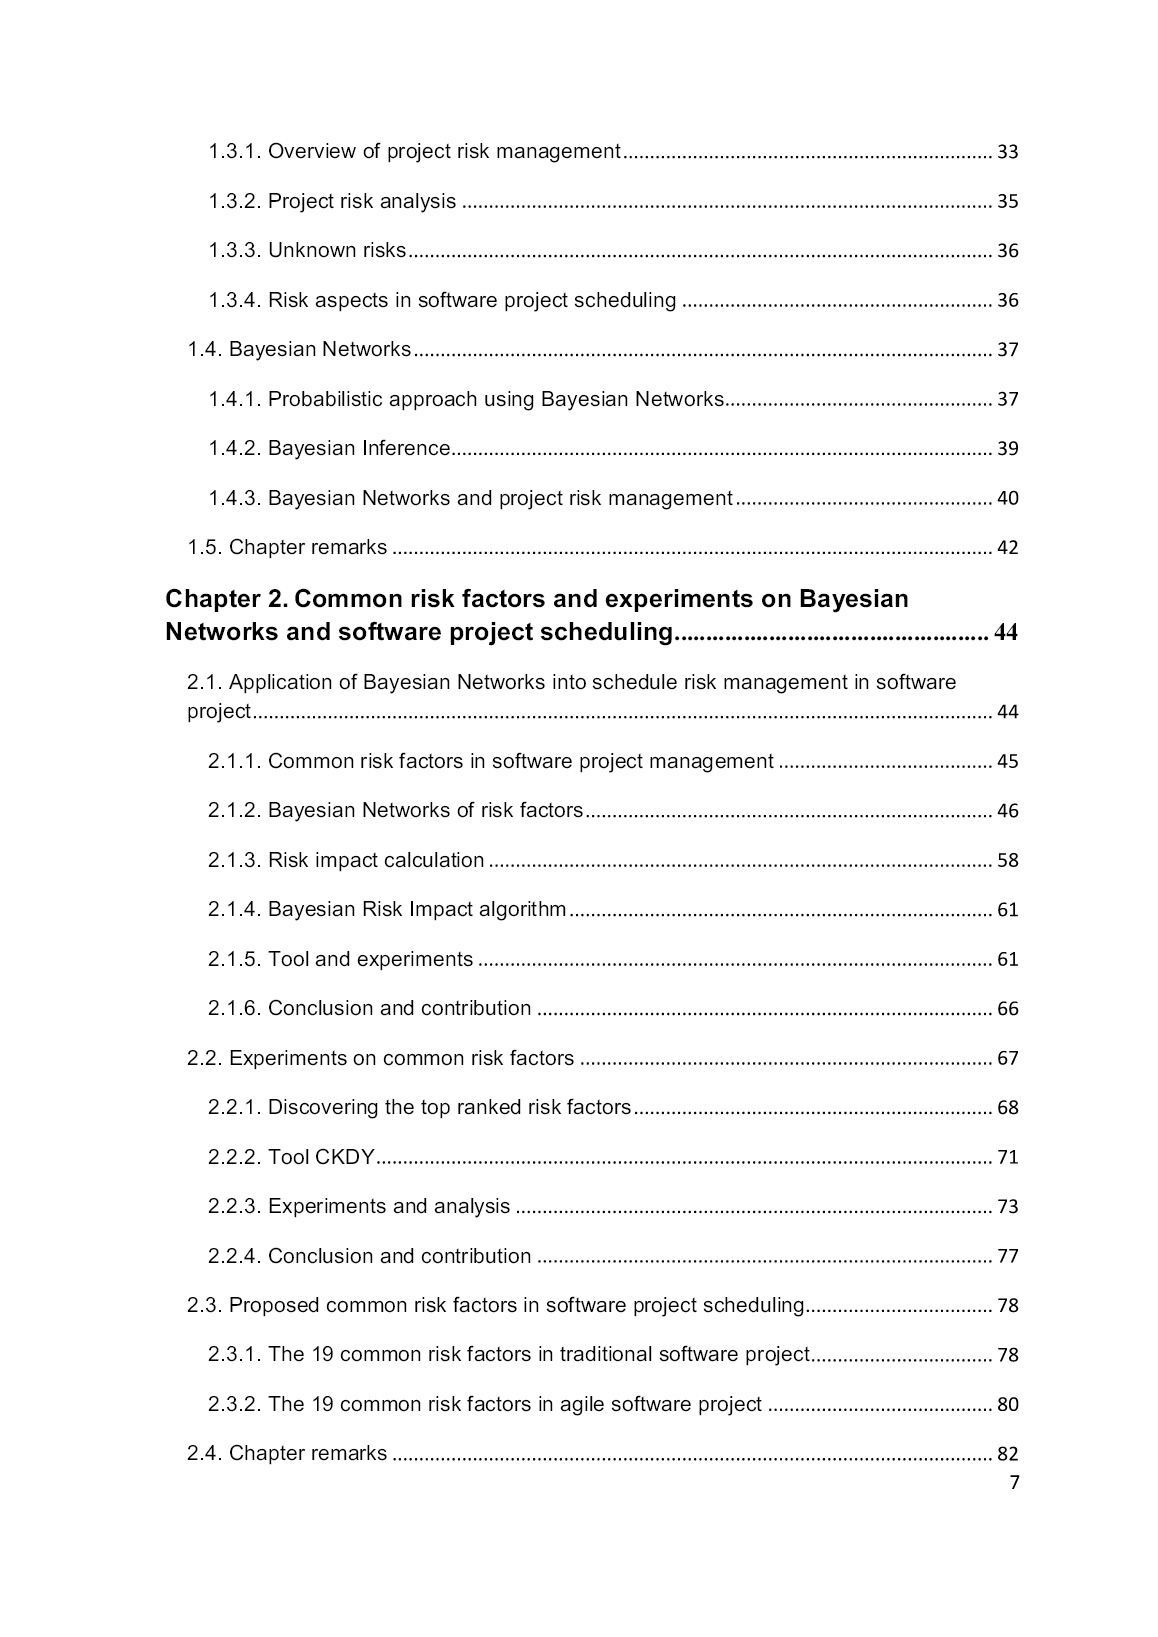
Trang 9
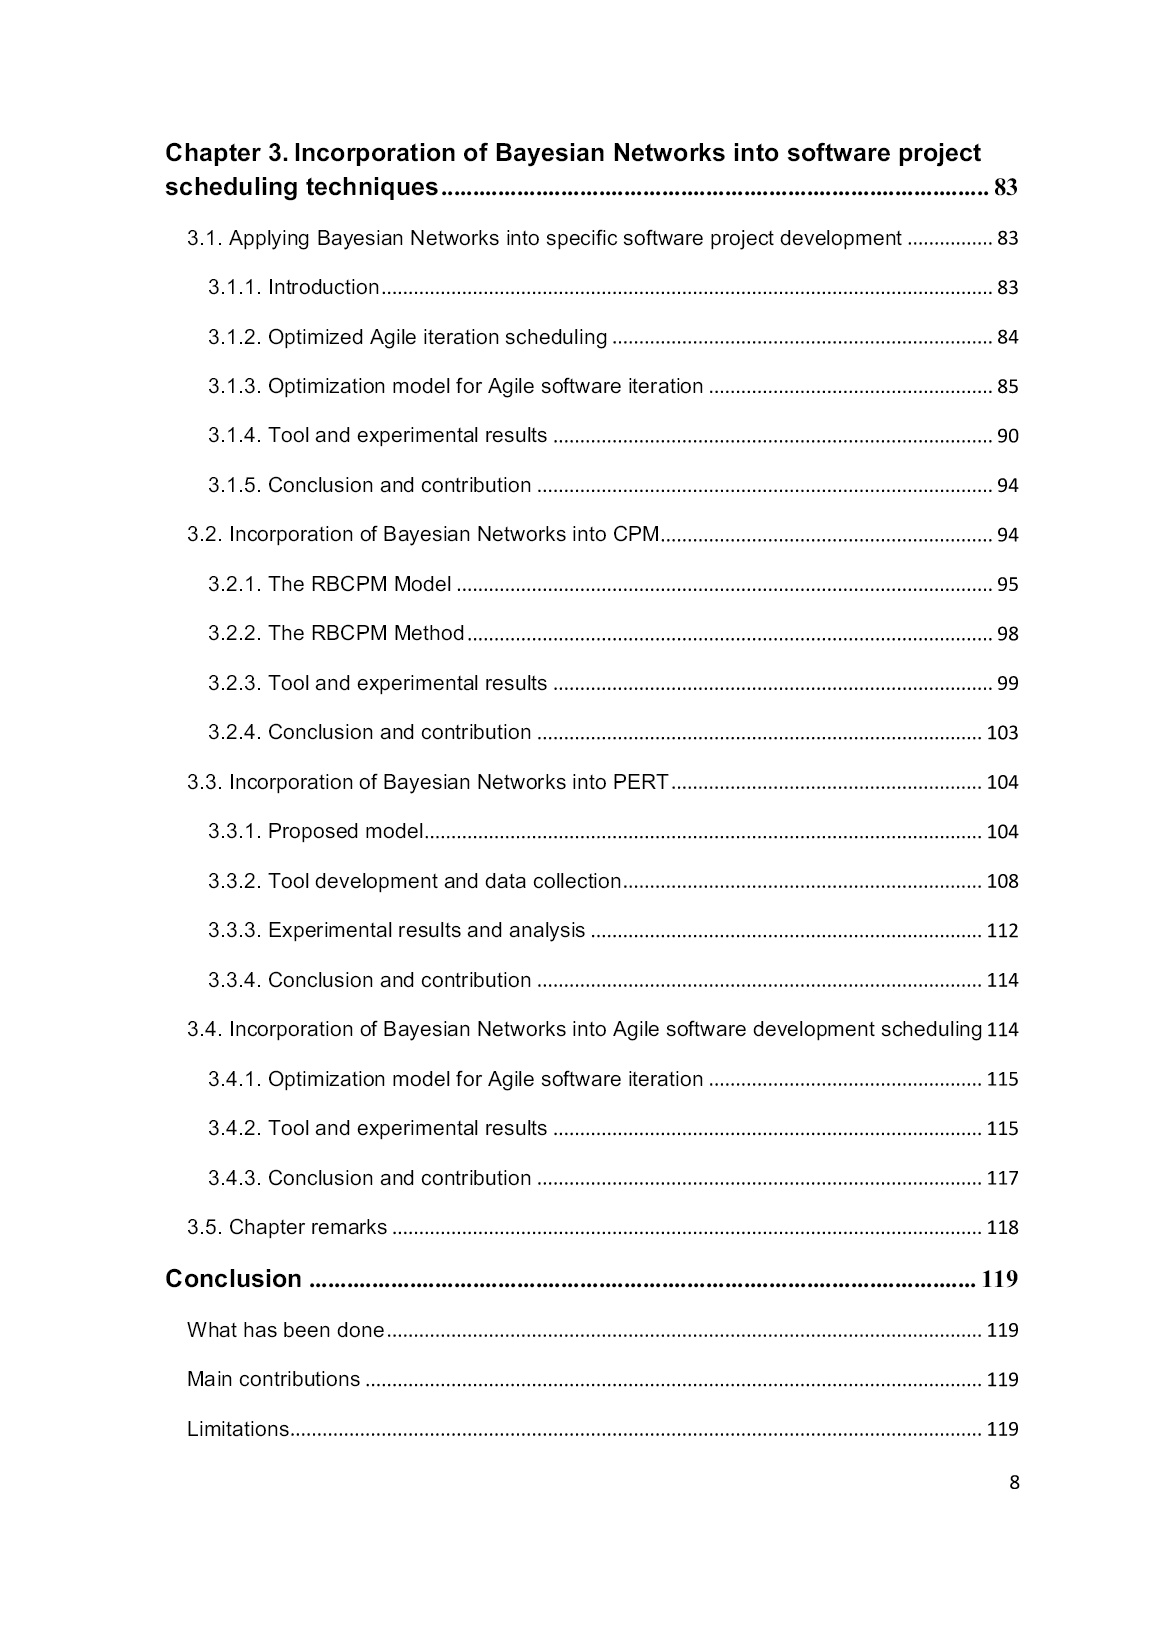
Trang 10
Tải về để xem bản đầy đủ
Bạn đang xem 10 trang mẫu của tài liệu "Luận án Risk management in software project scheduling using bayesian networks", để tải tài liệu gốc về máy hãy click vào nút Download ở trên.
Tóm tắt nội dung tài liệu: Luận án Risk management in software project scheduling using bayesian networks
equirements Figure 2.7. A sub BN for the risk factor “Lack of contact person competence” lack_of_quantitative_historical_data ++inaccuring_cost_estimating Figure 2.8. A sub BN for the risk factor “Lack of quantitative historical data” 50 inaccurate_cost_estimating +staff_experience_ shortage ++schedule_pressure Figure 2.9. A sub BN for the risk factor “Inaccurate cost estimating” ++large_and_complex_project large_and_complex_external_interface Figure 2.10. A sub BN for the risk factor “Large and complex external interface” +communication_overhead +++defect_rate large_and_complex_project Figure 2.11. A sub BN for the risk factor “Large and complex project” 51 ++project_size unnecessary_features Figure 2.12. A sub BN for the risk factor “Unnecessary features” ++project_size ++rework creeping_user_requirement Figure 2.13. A sub BN for the risk factor “Creeping user requirement” +defect_rate ++schedule_delay unreliable_subproject_delivery Figure 2.14. A sub BN for the risk factor “Unreliable subproject delivery” Figure 2.15 shows the sub BN of the risk factor “Incapable project management” which stated in literature to have high level of impact on project schedule. The experiments in this thesis will also confirm that. The risk factor relates to “Lack of senior management commitment” (which will also a common risk factor in all the lists examined in this thesis) and “Creeping user requirement”. According to Hui and Liu [9], these three risk factors all have high probability of affecting software projects. 52 Figure 2.15. A sub BN for the risk factor “Incapable project management” +staff_experience_ +low_moral shortage lack_of_senior_managem ent_commitment ++project_schedule +schedule_pressure Figure 2.16. A sub BN for the risk factor “Lack of senior management commitment” 53 lack_of_organization_maturity ++incurate_cost_estimating ++inadequate_process_method ++schedule_pressure Figure 2.17. A sub BN for the risk factor “Lack of organization maturity” +schedule_pressure +rework ++inadequate_process_ +productivity method immature_technology +defect_rate Figure 2.18. A sub BN for risk factor “Immature technology” 54 +rework ++defect_rate +productivity inadequate_configuration_ control +manual_efforts +project_schedule Figure 2.19. A sub BN for the risk factor “Inadequate configuration control” +defect_rate +productivity ++low_moral excessive_paper_work Figure 2.20. A sub BN for the risk factor “Excessive paperwork” 55 +schedule_pressure ++inaccurate_reporting ++inaccurate_cost_ estimating inaccurate_metrics Figure 2.21. A sub BN for the risk factor “Inaccurate metrics” +inaccurate_cost +schedule_pressure _estimating excessive_reliance_on_a_sing le_process_improvement +defect_rate Figure 2.22. A sub BN for risk factor “Excessive reliance on a single process improvement” 56 ++productivity +communication_overhead lack_of_experience_with_ project_environment ++staff_training Figure 2.23. A sub BN for the risk factor “Lack of experience with project environment” +defect_rate +communication_overhead lack_of_experience_with_project_software +productivity +staff_training Figure 2.24. A sub BN for the risk factor “Lack of experience with project software” Figure 2.25 shows the BN of overall model in software projects. 57 Figure 2.25. The overall BN for software risk factors 2.1.3. Risk impact calculation As discussed in Section 1.4.1, BNs allow us to associate probability distribution with each individual node. The initial probability distributions can be based on expert opinions, surveys, or mathematical methods. The derived probabilities can be calculated by Bayes rule, chain rules (as mentioned in Section 1.4.1) and Bayesian inference (as described in Section 1.4.2). We apply the following characteristics of BNs to calculate the impacts of risks in software projects [42]: - Expression of expert opinions, experiences or beliefs about the dependencies between different factors. - Consistent propagation of the impact of uncertain evidence on the probabilities of outcomes. - Calculation and revised calculation of probability when the evidence is known. Figure 2.26 illustrates how the above characteristics are applied. The Figure shows that the events x, y, and z are dependent of each other, x is independent of z with the condition y. 58 Figure 2.26. A simple example of Bayesian inference - Expert opinions, experiences, beliefs: z impacts y, and y impacts x. - Propagation of the impact of evidence: If we know that the probability of z happen is P(z) = 0.9, the condition probability of y given z happen is P(y|z) = 0.7 and the condition probability of x given both y and z happen P(x|y,z) = 0.6. Then by applying the chain rule, we can calculate that the probability P(x). - First we calculate P(y): P(y) P(yzi ) P(y | zi )P(z) Since: ___ P(yzi ) P(yz) P(y z ) Therefore: ___ ___ P(y) P(y | z)P(z) P(y | z )P( y ) __ Assume P(y | z) 0.5 , then: P(y) = 0.7x0.9 + 0.5x0.1 = 0.68 - Now we can calculate P(x): P(x)= P(x, yi z) P(x | yi z)P(yz) Since: __ P(x, yi z) P(xyx) P(x y z) Therefore: 59 __ __ P(x)=P(x|yz)P(y)+P(x| y z)P( y) __ Assume P(x | y z) 0.5 , then: P(x) = 0.6x0.68 + 0.5x0.32 = 0.568. Given Figure 2.26, the formula to calculate p(x|z): p x | z P(x | z yi )P(yi | z) yi (2.1) P(x | yi )P(yi | z) yi Bayes Theorem has a very important property that we can calculate revised parent probability when we know that the child is true. Recall formula 1.2 that: P(x|y) = P(y|x)*P(x)/P(y). + Revised probability of y being true: P(y|x) = (P(x|y)*P(y))/P(x) = 0.6 * 0.68 / 0.568 = 0.7183. + Revised probability of z being true: P(z|y) = (P(y|z)*P(z))/P(y) = 0.7 * 0.9 / 0.68 = 0.9265. Based on the above model, we looked at an algorithm that calculates the impact of risk factors, allowing project managers to estimate and make appropriate decisions for the team development, aiming to bring the software project completed on time. Figure 2.27. The three nodes of a simple-chain BN 60 Which is in Figure 2.27: x: the examined risk; y: the risk directly generated from the examined risk; z: the risk generated in the condition that the two previous risks occurred. P(y|x), P(z|xy): possibilities of risks when the conditions are true (in three weight levels: + (low) (p=0.3), ++ (medium) (p=0.6), +++(high) (p=0.9)). 2.1.4. Bayesian Risk Impact algorithm We propose the algorithm BRI (Bayes Risk-Impact) to assess the impact of risk factors. The algorithm BRI * Input: Risk factors and probability (Table 2.1) * Output: The degree of the impact of the risk factor on the fulfillment of a software project in the form of a vector of numerical values. The higher the value, the greater the impact. *The BRI algorithm assesses the impact of risk factors: Step 1. Based on known probabilities, for example P(X|~parent(X)) = 0.4, calculate the possibilities of child nodes in each sub BN. Step 2. With each child node, recursively find ImpactWeight(child_node). Find Bayesian networks started by the examined child node in the original BN. Calculated ImpactWeight(child_node) with the probability calculated in Step 1. If not found, ImpactWeight(child_node) = P(child_node). Step 3. ImpactWeight(examined_risk) = ∑ImpactWeight(child_node). Step 4. Sum up together ImpactWeight(examined_risk) into impact vector. Step 5. Repeat to examine next risk. 2.1.5. Tool and experiments a) Building tool The purpose of the tool is to stimulate the above model and algorithm, helping managers assess the level of impact of the risks on the ability to complete a software project when the probability of occurrence of the risks is known in advance. The software is built in C# programming language, with MS.NET Framework 4.5 61 library and the integrated developer environment (IDE) is Visual Studio 2012. The graphical interface of the software is shown in Figure 2.28. Figure 2.28. The graphical interface of the tool To use this tool, it is only required to input the initial probabilities of the risk factors or the tool can simply accept the default probabilities that were established in the tool based on research results. The tool then, will automatically calculate the impacts weight level in terms of a numeric value. At the different phases of a software project, managers and project teams can assess the risks and their probabilities of occurrence, as well as making decisions in 62 the planning and management tasks. Through a comparison of the metrics, the project team will make decisions to the software project. b) Experiments The sample data set is the data of 2 real software projects and the results of the research of Hui and Liu [9] which is shown in Table 2.1. Test results (calculation of impact levels of risk factors) with the data of the research of Hui and Liu [9] (the risk factors and the initial probabilities of the risk factors are shown in Table 2.1) are summarized in Figure 2.29. The results show that the two factors have the highest impacts are “incapable project management” and “lack of client support”. This result fits with the fact that the sub-BNs of these risk factors are of the most complex ones which related to some other key risk factors (Figure 2.6 and Figure 2.15). Figure 2.29. Result of experiment 1 With the two real-life projects, the project managers and secretaries based on their practical experience in those projects to help the authors estimate the initial probability of the risk factors. Project 1 is a project about a social networking game, consisting of 8 people (1 admin, 1 tester, 5 developers and 1 designer). The project is expected to be in 4.5 months but last for 10 months. Some of the main problems encountered by the 63 project team were the large self-built framework, many bugs generated, workloads, and slow response. Project 2 is an outsourcing software project for a Japanese telecommunications company. This project is expected to be done in 5 months with 15 stages, but in fact it lasted in 10 months like Project 1. The biggest problems encountered are identifying customer requirements (in phase 1), assessing the complexity of each module to allocate resources, and a long lead time for transfer and guidance to customer. Table 2.2. Risk factors in the phases Impact (High, Phase Risk factor Probability Medium, Low) Requirements Creeping user requirement High 0.5 Identification Requirements Incapable project management High 0.1 Identification Requirements Lack of client support High 0.2 Identification Requirements Staff experience shortage High 0.4 Identification Software Design Staff experience shortage High 0.2 Software Design Immature technology Medium 0.1 Software Design Unnecessary features Medium 0.99 Experiment method: joint testing for all 3 data sets and testing in each phase of each project. The general experimental results are shown in the comparison chart in Figure 2.30. Experimental results with all three data sets show the similarity of the 64 levels of impacts (all high) of the risk factors (e.g. incapable project management, lack of client support, or excessive reliance on a single process...). With Project 2 data: since the project is well organized from the early phases, the author would like to go into the analysis of the impact of risk factors in each phase of the project. The authors have been provided with estimates/ assessments by the project manager on possible risks in some phases as shown in Table 2.2. The project team highly considered the influence of factors incapable project management and lack of client support. The experimental results of the software with the Requirements Identification phase show more clearly: for this phase, the greatest level of risk impact is incapable project management, which requires the improvement of management skills and quality; there should be clear and specific commitments from project managers; do not let errors occur while making management requests and accurately identify user requirements. For Software Design phase, the biggest risk impact is from immature technology (Figure 2.31), this requires a strategy to avoid risks when handling methods; minimize the risk of schedule pressure. According to the project manager, this result is consistent with what happened in Project 2. Figure 2.30. Results of the three experiments 65 Based on the vector of the influence level of risks in each project period and the overall project, it is possible to realize that the management's risk affects the ability to complete the project on time as well as project success. The bigger the project, the more complex it is and the more risk factors that need the higher skills level, experience, and capabilities of the project manager. Other important factors are lack of commitment and support from clients, incapable project management, and excessive reliance on a single process... This result confirms the need for supportive tools for the project team to estimate, evaluate and promptly adjust. Project managers need to pay more attention to the risk factors that have the greatest impact on the project to ensure the project is carried out smoothly. Figure 2.31. Experimental results for Software Design phase 2.1.6. Conclusion and contribution The tool and experimental results show that the algorithm BRI accurately assesses the impact of risk factors on the project schedule. The algorithm would quickly help the management team to foresee impacts weight caused by their risk factors. Users of the experimental tool are only required to input the initial probabilities of the risk factors or they can simply accept the default probabilities that were established in the tool based on our research results. Project managers need to pay more attention to the risk factor that causes highest impacts in order to keep their software development projects from falling into troubles, especially time, cost and quality ones. 66 The proposed models, algorithms and tools, in addition to quantifying risks and their consequences, can also help identify problems and potential risks at the first phase of the project – project scheduling and project planning. The authors also assert that if we can identify and control issues from the early phases of the project, we can significantly increase the likelihood of the project's success. Although the BN model generally provides an accurate picture of the risks of typical software projects at an early phase, it still needs further development especially when using it for other specific industries, or at later phases of software development projects. Therefore, further research on this issue can focus on implementing the application of BN technique in modelling risks in project scheduling by incorporating BNs with different project scheduling techniques (CPM, PERT, simulation ...), then evaluate and make better recommendations to the project team. The author would also collect and run the algorithm with more empirical data sets, so that there is better evaluation and analysis for the algorithm. An expert survey will also be carried out so that, together with the test results of the tool, a list of risk factors that best suits each type of software developed as well as each method of software development. The authors will also study more closely and integrate more sources of risk into the scheduling process and how to deal with other types of unforeseen factors (such as unknown unknowns). The final development of the project is the management of actions and decision making support for project managers when the project has a scheduling problem (some phase is delayed or the whole project is delayed) by evaluating multiple schedule scenarios right during the project scheduling process. 2.2. Experiments on common risk factors This section is the work whose results were represented in publication 3 [PUB3]. In reality, all the phases of the software development life cycle (SDLC) are potential sources of uncertainty since they have to deal with hardware, software, technology, people, cost, and processes. Current state-of-the-art scheduling techniques based on the assumption that every task, activity or phase of the project is carried out exactly as it is planned, which almost never happens in real-life projects. Recent research on risk management focuses on the relationships between uncertainty (risk factors) and the outcomes of a project. This section examines a model and a probabilistic tool CKDY using Bayesian Belief Network to evaluate risk factors in software project scheduling. 67 2.2.1. Discovering the top ranked risk factors We apply the method proposed by Kumar and Yadav [24] including 4 steps: (1) Selecting the top ranked risk factors in software project scheduling; (2) Constructing causal relationships among the software risk factors; (3) Constructing the node probability table (NPT) for each node (factor) of the model; (4) Calculating the probability value of software risk factors for the project. In each step, we choose the right solution to put into the building of the tool CKDY. The following is a detailed description of the options. a) Selecting the top ranked risk factors The risk factors in software project scheduling depend on various software aspects such as project size, budget, human resources etc. There are certain sources of useful information for identifying risk factors such as previous research and analysis, historical data and lessons learned, system safety and reliability analysis, expert interviews etc. A number of software risk prediction and risk assessment models using software risk factors has been proposed [33, 84, 85]. Most of the existing models evaluate a number of risk factors, although some risk factors are not suitable for some types of projects, or less important. However, assessment and estimation of software risk by taking all the risk factors have some drawbacks like: computationally complex and more expensive processing cost. Selecting the most important software risk factors that affect an entire project or each phase of the project could increase the accuracy of the risk prediction and risk assessment. We synthesize from a number of published risk factors such as SEI risk classification [86], NASA NPD2820 risk classification [87], along with research results (24 risk factors) of Hui and Liu [9], the selected 27 risk factors by Kumar and Yadav [24], to select a set of risk factors in software project scheduling to test the method proposed by Kumar and Yadav [24]. The set of 5 top ranked risk factors in software project scheduling is shown in Table 2.2. These risk factors have consequences on the software project and eventually lead to the project over scheduled. Table 2.3. Risk factors, consequences and impact Component Sub component Risk Factors Poor management skills and experience Pressure on the schedule Frequent changes in customer requirements Inappropriate process 68 Component Sub component Inappropriate technology Consequences Incomplete mission Wasted resources Reliability Impact Over scheduled b) Constructing causal r
File đính kèm:
 luan_an_risk_management_in_software_project_scheduling_using.pdf
 2TOM TAT LUAN AN-EN.pdf
 2TOM TAT LUAN AN-VI.pdf
 3TRICH YEU LUAN AN.pdf
 4THONG TIN TOM TAT VE KET LUAN MOI CUA LUAN AN.pdf

